. 2013 Sep 27:6:821-8.
doi: 10.2147/IJGM.S52209. eCollection 2013.

Causal diagrams, the placebo effect, and the expectation effect

Affiliations

Causal diagrams, the placebo effect, and the expectation effect

Eyal Shahar et al. Int J Gen Med. .

Abstract

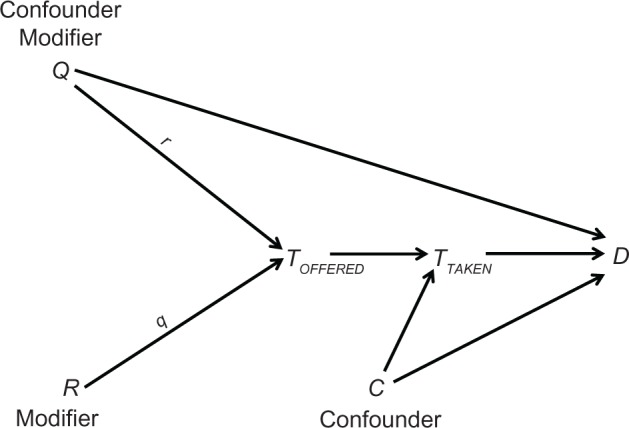
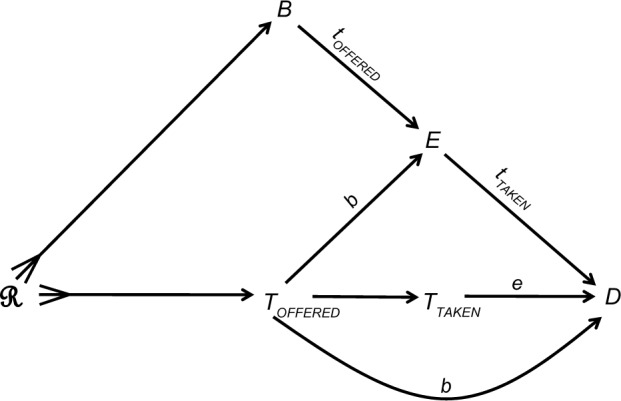
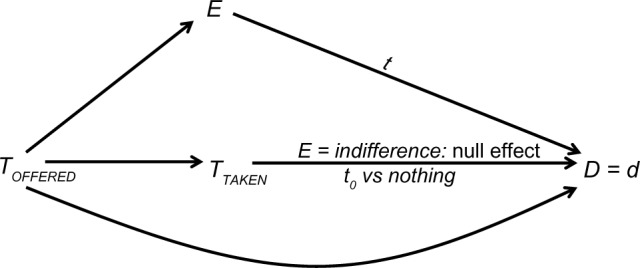
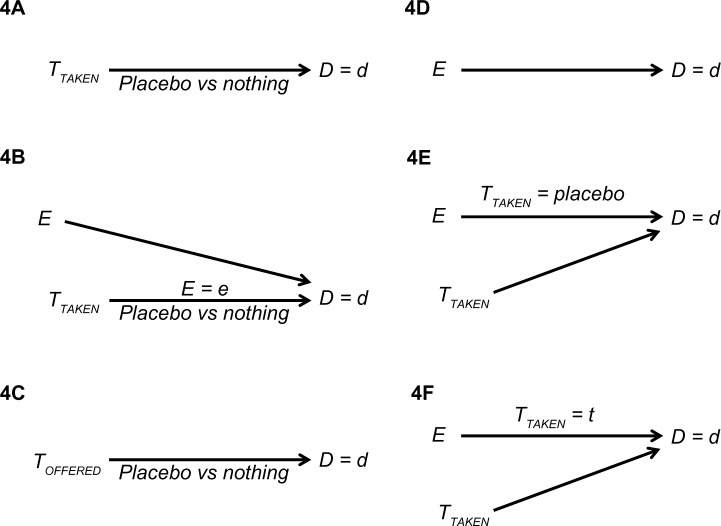
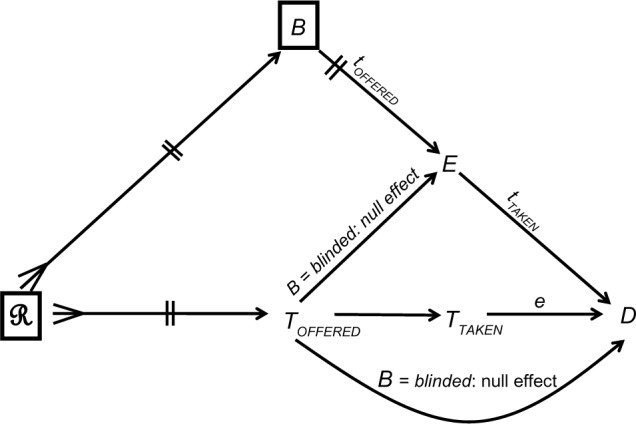
Using causal diagrams, a formal research methodology, we analyzed several definitions of placebo and the placebo effect. We conclude that placebo is an ambiguous, redundant term and that the so-called placebo effect conceals far more interesting effects that are attributed to the patient's expectation. Biomedical research will benefit from abandoning the term placebo effect and focusing instead on a deeper understanding of the expectation variable, including its causes, effects, and effect modifiers. This avenue of research should be pursued by observational cohorts that are nested within clinical trials.

Keywords: causal diagrams; effect modification; expectation; placebo.


Figures

Figure 1
Figure 1
A causal diagram. Notes: TOFFERED denotes the treatment offered; TTAKEN denotes the treatment taken; D denotes the outcome; R, Q, and C are generic variables; r denotes a value of the modifier R; q denotes a value of the modifier Q.
Figure 2
Figure 2
A causal structure, incorporating causes of the offered treatment (ℛ), blinding status (B), and the patient’s expectation (E) of the outcome (D). Notes: TOFFERED denotes the treatment offered; TTAKEN denotes the treatment taken; a lower case letter denotes a value of the modifier (e.g. tOFFERED is a value of TOFFERED).
Figure 3
Figure 3
A proposed definition of placebo (t0). Notes: TOFFERED denotes the treatment offered; TTAKEN denotes the treatment taken; E denotes the patient’s expectation of the outcome D = d; t denotes a value of TTAKEN.
Figure 4
Figure 4
Various definitions of the placebo effect. Notes: TOFFERED denotes the treatment offered; TTAKEN denotes the treatment taken; E denotes the patient’s expectation of the outcome D = d.
Figure 5
Figure 5
The causal structure of a successful double-blinded, randomized trial. Notes: ℛ denotes all causes of the offered treatment B denotes blinding status; Toffered denotes the treatment offered; TTAKEN denotes the treatment taken; E denotes the patient’s expectation of the outcome D = d; a lower case letter denotes a value of the modifier (e.g. toffered is a value of Toffered) A box denotes conditioning (see text).
Figure 6
Figure 6
Three designs for studying the placebo effect. (A) three arms. (B) Concealed treatment. (C) Balanced placebo design.

Similar articles

Cited by

References

    1. Brody H, Miller FG. Lessons from recent research about the placebo effect – from art to science. JAMA. 2011;306(23):2612–2613. - PubMed
    1. Kirsch I. The placebo effect revisited: lessons learned to date. Complement Ther Med. 2013;21(2):102–104. - PubMed
    1. Macedo A, Farré M, Baños JE. Placebo effect and placebos: what are we talking about? Some conceptual and historical considerations. Eur J Clin Pharmacol. 2003;59(4):337–342. - PubMed
    1. Colloca L. The influence of the nocebo effect in clinical trials. Open Access Journal of Clinical Trials. 2012;4:61–68.
    1. Shahar E, Shahar DJ. Causal diagrams and the logic of matched case-control studies. Clin Epidemiol. 2012;4:137–144. - PMC - PubMed

LinkOut - more resources