. 2013 Oct 1:7:153.
doi: 10.3389/fncir.2013.00153. eCollection 2013.

A method for the three-dimensional reconstruction of Neurobiotin™-filled neurons and the location of their synaptic inputs

Affiliations

A method for the three-dimensional reconstruction of Neurobiotin™-filled neurons and the location of their synaptic inputs

Matthew J Fogarty et al. Front Neural Circuits. .

Abstract

Here, we describe a robust method for mapping the number and type of neuro-chemically distinct synaptic inputs that a single reconstructed neuron receives. We have used individual hypoglossal motor neurons filled with Neurobiotin by semi-loose seal electroporation in thick brainstem slices. These filled motor neurons were then processed for excitatory and inhibitory synaptic inputs, using immunohistochemical-labeling procedures. For excitatory synapses, we used anti-VGLUT2 to locate glutamatergic pre-synaptic terminals and anti-PSD-95 to locate post-synaptic specializations on and within the surface of these filled motor neurons. For inhibitory synapses, we used anti-VGAT to locate GABAergic pre-synaptic terminals and anti-GABA-A receptor subunit α1 to locate the post-synaptic domain. The Neurobiotin-filled and immuno-labeled motor neuron was then processed for optical sectioning using confocal microscopy. The morphology of the motor neuron including its dendritic tree and the distribution of excitatory and inhibitory synapses were then determined by three-dimensional reconstruction using IMARIS software (Bitplane). Using surface rendering, fluorescence thresholding, and masking of unwanted immuno-labeling, tools found in IMARIS, we were able to obtain an accurate 3D structure of an individual neuron including the number and location of its glutamatergic and GABAergic synaptic inputs. The power of this method allows for a rapid morphological confirmation of the post-synaptic responses recorded by patch-clamp prior to Neurobiotin filling. Finally, we show that this method can be adapted to super-resolution microscopy techniques, which will enhance its applicability to the study of neural circuits at the level of synapses.

Keywords: 3D-reconstruction; brainstem; dendrite; motor neuron; synapse.


Figures

Figure 1
Figure 1
Creating a neuronal surface. (A,D) show low and high magnification the maximum intensity projection of a Neurobiotin-filled hypoglossal motor neuron (Cy3) and excitatory synaptic components VGLUT2 (green) and PSD-95 (purple). (B,E) show low and high magnification 3D isometric view of the same neuron in Imaris. (C,F) show low and high magnification of the neuronal surface created in Imaris using the “create surface” tool. Scale bars: (A,B,C) 5 μm and (D,E,F) 2.5 μm.
Figure 2
Figure 2
Defining pre- and post-synaptic spots. (A,D) show low and high power magnification of post-synaptic PSD-95 (purple) fluorescence in the entire confocal z-stack from Figure 1. (B,E) show the post-synaptic PSD-95 (purple) fluorescence filtered to inside the neuronal surface using the “mask all” tool in Imaris. (G,J) show low and high power magnification of pre-synaptic VGLUT2 (green) fluorescence in the entire confocal z-stack from Figure 1. (H,K) show the pre-synaptic VGLUT2 (green) fluorescence filtered to outside the neuron surface using the “mask all” tool in Imaris. (C,F,I,L) show low and high-powered magnifications of post-synaptic PSD-95 (purple) and pre-synaptic VGLUT2 (green) identified using the “create spots” algorithm in Imaris. Scale bars: (A,B,C,G,H,I) 5 μm and (D,E,F,J,K,L) 2.5 μm.
Figure 3
Figure 3
Pre- and post-synaptic localizations to the motor neuron. (A,D) show the pre-synaptic VGLUT2 (green) and post-synaptic PSD-95 (purple) Imaris-generated “spots” from the neuronal surface masked fluorescence in Figure 2. (B,E) show these spots co-localized to within 1 μm using the “co-localize spots” algorithm in Imaris. As all of the post-synaptic elements (PSD-95, purple) are already filtered to be on the neuron, we get a quantification of pre- (VGLUT2, green) and post-synaptic components (PSD-95, purple) with regard to the Neurobiotin-filled hypoglossal motor neuron (shown in transparent gray-Cy3) in (C) and (F). Scale bars: (A,B,C), 5 μm and (D,E,F) 2.5 μm.
Figure 4
Figure 4
Pre-synaptic and post-synaptic localizations to the filled motor neuron. (A,B) show the pre-synaptic VGLUT2 (green) localized to within 1 μm of the neuronal surface and post-synaptic PSD-95 (purple) Imaris-generated “spots” with the neuronal surface. Evident is the increased amount of VGLUT2 puncta quantified using the neuron as the localization point, as opposed to the post-synaptic specialization used in Figure 3. Scale bars: (A) 5 μm and (B) 2.5 μm.
Figure 5
Figure 5
GABAergic and glutamatergic synapses on the somas and distal dendrites of P0 hypoglossal motor neurons. (A) shows a Neurobiotin-filled hypoglossal motor neuron soma and proximal dendrites double-labeled with inhibitory GABAergic synaptic components VGAT (green) and GABA-A receptor subunit α1 (purple). (B) shows a Neurobiotin-filled hypoglossal motor neuron soma and proximal dendrites double-labeled with excitatory glutamatergic synaptic components VGLUT2 (green) and PSD-95 (purple). Note that the GABAergic synapses are more prevalent than glutamatergic synapses on P0 hypoglossal motor neuron cell somas and proximal dendrites. (C) shows distal dendrite of hypoglossal motor neuron double-labeled with inhibitory GABAergic synaptic components VGAT (green) and GABA-A receptor subunit α1 (purple). (D) shows a distal dendrite of hypoglossal motor neuron double-labeled with excitatory glutamatergic synaptic components VGLUT2 (green) and PSD-95 (purple). Note that the glutamatergic synapses are more prevalent than GABAergic synapses on P0 hypoglossal motor neuron distal dendrites. Scale bar: (A,B) 5 μm and (C,D) 20 μm.
Figure 6
Figure 6
Excitatory and inhibitory immuno-labels do not substantially overlap when localized to motor neurons. (A) shows the co-localization (within 1 μm) of post-synaptic excitatory PSD-95 (purple) and inhibitory GABA-A receptor subunit α1 (green) on a Neurobiotin = filled hypoglossal motor neuron (gray). Only 15% of all PSD-95 spots are co-localized with a GABA-A receptor subunit α1 puncta. (B) shows the co-localization (within 1 μm) of pre-synaptic excitatory VGLUT2 (purple) and inhibitory VGAT (green) within 1 μm from the surface of a Neurobiotin = filled hypoglossal motor neuron (gray). Note that less than 10% of all VGLUT2 terminal boutons are co-localized with VGAT terminals. Scale bar: 5 μm.
Figure 7
Figure 7
Increased accuracy of synaptic component quantification by the super-resolution microscopy compared to the conventional confocal microscopy. (A) shows a maximum intensity projection of a wide-field z-stack imaging Neurobiotin-filled hypoglossal motor neuron distal dendrites (red) with glutamatergic VGLUT2 (green) and PSD-95 (purple). (B) shows a maximum intensity projection of a super-resolution z-stack imaging of same distal dendrites (red) with glutamatergic synapse labeling with VGLUT2 (green) and PSD-95 (purple). Inset (C) shows the Imaris method when applied to the super-resolution sample, with the neuronal surface (gray), co-localized to within 1 μm of each other VGLUT2 (green) and PSD-95 (purple). VGLUT2 spots that are within 1 μm of the neuronal surface are colored blue. Scale bars: (A,B) 10 μm and (C) 5 μm.
Figure 8
Figure 8
Electrophysiological recording of inward and outward spontaneous synaptic currents shows correlation with excitatory and inhibitory synaptic labeling in hypoglossal motor neurons. Inward synaptic currents are more frequent and have a different waveform to outward synaptic currents; (A1) shows a continuous recording of spontaneous inward synaptic currents at a membrane potential of −60 mV, while (A2) shows the averaged waveform of a single inward synaptic current, with a fast 10–90% rise time and decay time. (B1) shows a continuous recording of spontaneous outward synaptic currents at a membrane potential of 0 mV, from the same hypoglossal motor neuron shown in (A), while (B2) shows the averaged waveform of a single outward synaptic current; note that the 10–90% rise time and decay time of the outward current are slower than seen in inward synaptic currents (B2). Inward and outward synaptic currents arise from different populations of synaptic inputs to the hypoglossal motor neuron; (C) is the cumulative frequency distribution of the absolute amplitudes of all inward currents (n = 349) at −60 mV and outward currents (n = 142) at 0 mV recorded from the same neuron; the distributions are significantly different (Kolmogorov–Smirnov test, P < 0.0001), while (D) is the cumulative frequency distribution of the inter-event interval of all inward and outward currents from the same neuron; the distributions are also significantly different (Kolmogorov–Smirnov test, P < 0.0001). Inward synaptic currents have a positive reversal potential consistent with being excitatory glutamatergic currents, while outward currents have a negative reversal potential consistent with being inhibitory GABAA/glycinergic synaptic currents; (E) shows the current-voltage relationship of the mean amplitude of inward (open circles) and outward (filled circles) currents at different membrane potentials (MP); linear regression of current amplitude against MP (solid lines) shows that the slope and MP intersection for zero current are both significantly different; the dashed lines show the 95% confidence intervals for linear regression. Inward currents have a significantly faster 10–90% rise times and decay time constant, compared to outward currents; (F) shows that the distribution of inward and outward current 10–90% rise times from the same hypoglossal motor neuron are significantly different (P < 0.0001), as are the distributions of decay time constants for the same currents (G). Both data sets (F,G) are shown as box-and-whiskers plots, where the box shows the mean, whiskers are from the 5 to 95 percentile, and circles show outliers below or above these limits. ***P <0.0001, Student t-test.
Figure 9
Figure 9
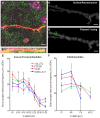
Imaging and methodological considerations. (A) Shows a maximum intensity projection in the xy-axis of a representative distal dendrite (red fluorescence) and excitatory pre-synaptic VGLUT2 (green) and post-synaptic PSD-95 (purple). (B) Shows the same fluorescence in the xz-axis, indicating penetration of all immuno-labeling within dendritic z-stacks. We show the same dendrite with our above method applied to quantify synaptic components using two different methods of defining the dendritic volume, namely, surface reconstruction (C) and filament tracing (D). We show that equivalent results with regard to synapse quantifications using either surface reconstruction filtering or filament trace filtering. For surface filtering of data, 2 spots internal (PSD-95), 3 spots external (VGLUT2), 2 synapses in total. For filament trace filtering of data, 2 spots internal (PSD-95), 4 spots external (VGLUT2), 2 synapses in total. Frequency histogram analysis of “spot detection” labeling density (%) for all immuno-labels and all regions, the soma and proximal dendrites (E) and distal dendrites (F) illustrated the effective depth of antibody penetration from the top of the confocal z-stack. Note the top of the confocal stack was some depth below, up to 20 μm from the surface of tissue slice. For each immuno-label (i.e., colored line), the number of puncta in each depth bin (binned in 5 μm increments for the soma and 3 μm increments in the distal dendrites) was calculated as a percentage of the total number of puncta at all depths sampled (reading x-axis from left to right). In regard to the distal dendrites (F), the smaller z-depth shown was not due to poor antibody penetration, but rather, was due to the smaller z-stack required to image distal dendrites, as our sampling ended ~2 μm below the dendrite of interest [see (B) as a typical example of the shallow z-depth of a distal dendrite. Thus, the puncta frequency distribution for distal dendrites was largely within the first 6 μm of z-depth. Scale bars: (A,B) 10 μm and (C,D) 2 μm.

Similar articles

Cited by

References

    1. Aldes L. D., Marco L. A., Chronister R. B. (1989). Serotonin-containing axon terminals in the hypoglossal nucleus of the rat. An immuno-electronmicroscopic study. Brain. Res. Bull. 23, 249–256 10.1016/0361-9230(89)90154-8 - DOI - PubMed
    1. Anagnostopoulos A. V., Sharp J. J., Mobraaten L. E., Eppig J. T., Davisson M. T. (2001). Availability and characterization of transgenic and knockout mice with behavioral manifestations: where to look and what to search for. Behav. Brain. Res. 125, 33–37 10.1016/S0166-4328(01)00284-4 - DOI - PubMed
    1. Arthur C. P., Serrell D. B., Pagratis M., Potter D. L., Finch D. S., Stowell M. H. (2007). Electron tomographic methods for studying the chemical synapse. Methods Cell. Biol. 79, 241–257 10.1016/S0091-679X(06)79010-0 - DOI - PubMed
    1. Ausdenmoore B. D., Markwell Z. A., Ladle D. R. (2011). Localization of presynaptic inputs on dendrites of individually labeled neurons in three dimensional space using a center distance algorithm. J. Neurosci. Methods 200, 129–143 10.1016/j.jneumeth.2011.06.021 - DOI - PubMed
    1. Bae Y. C., Nakamura T., Ihn H. J., Choi M. H., Yoshida A., Moritani M., et al. (1999). Distribution pattern of inhibitory and excitatory synapses in the dendritic tree of single masseter alpha-motoneurons in the cat. J. Comp. Neurol. 414, 454–468 - PubMed

Publication types