. 2013:2013:396056.
doi: 10.1155/2013/396056. Epub 2013 Sep 11.

The use of porous scaffold as a tumor model

Affiliations

The use of porous scaffold as a tumor model

Mei Zhang et al. Int J Biomater. 2013.

Abstract

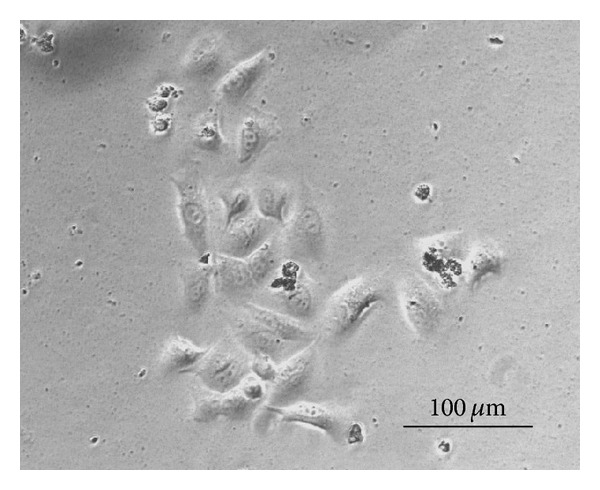
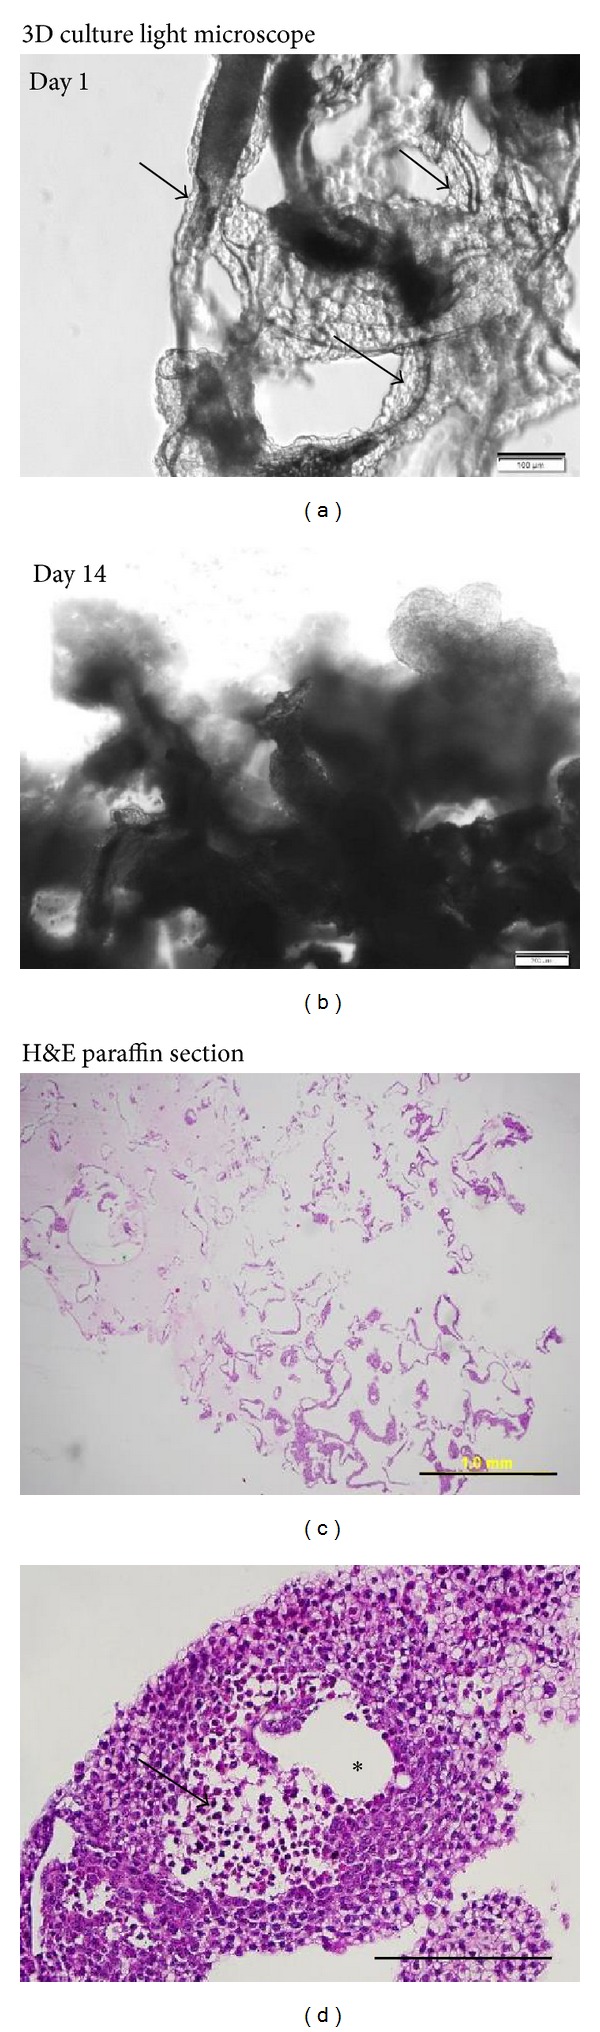
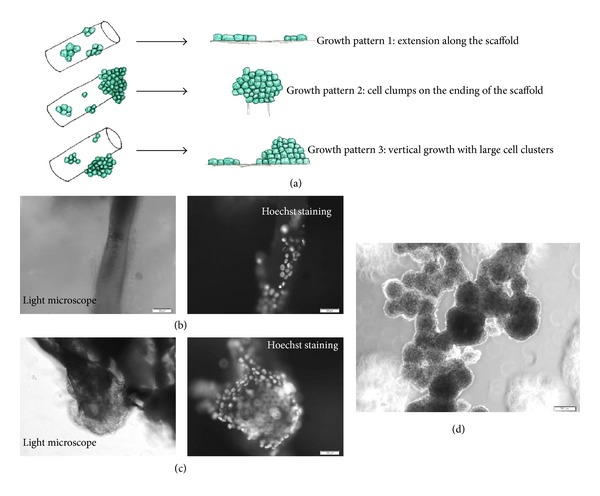
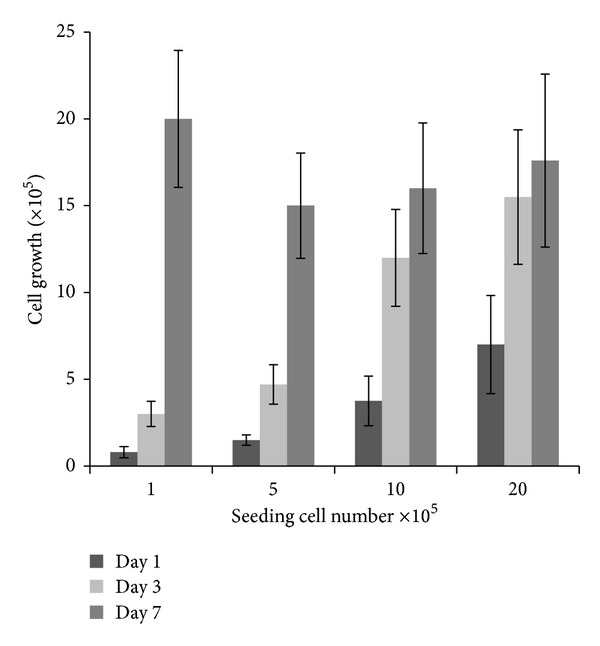
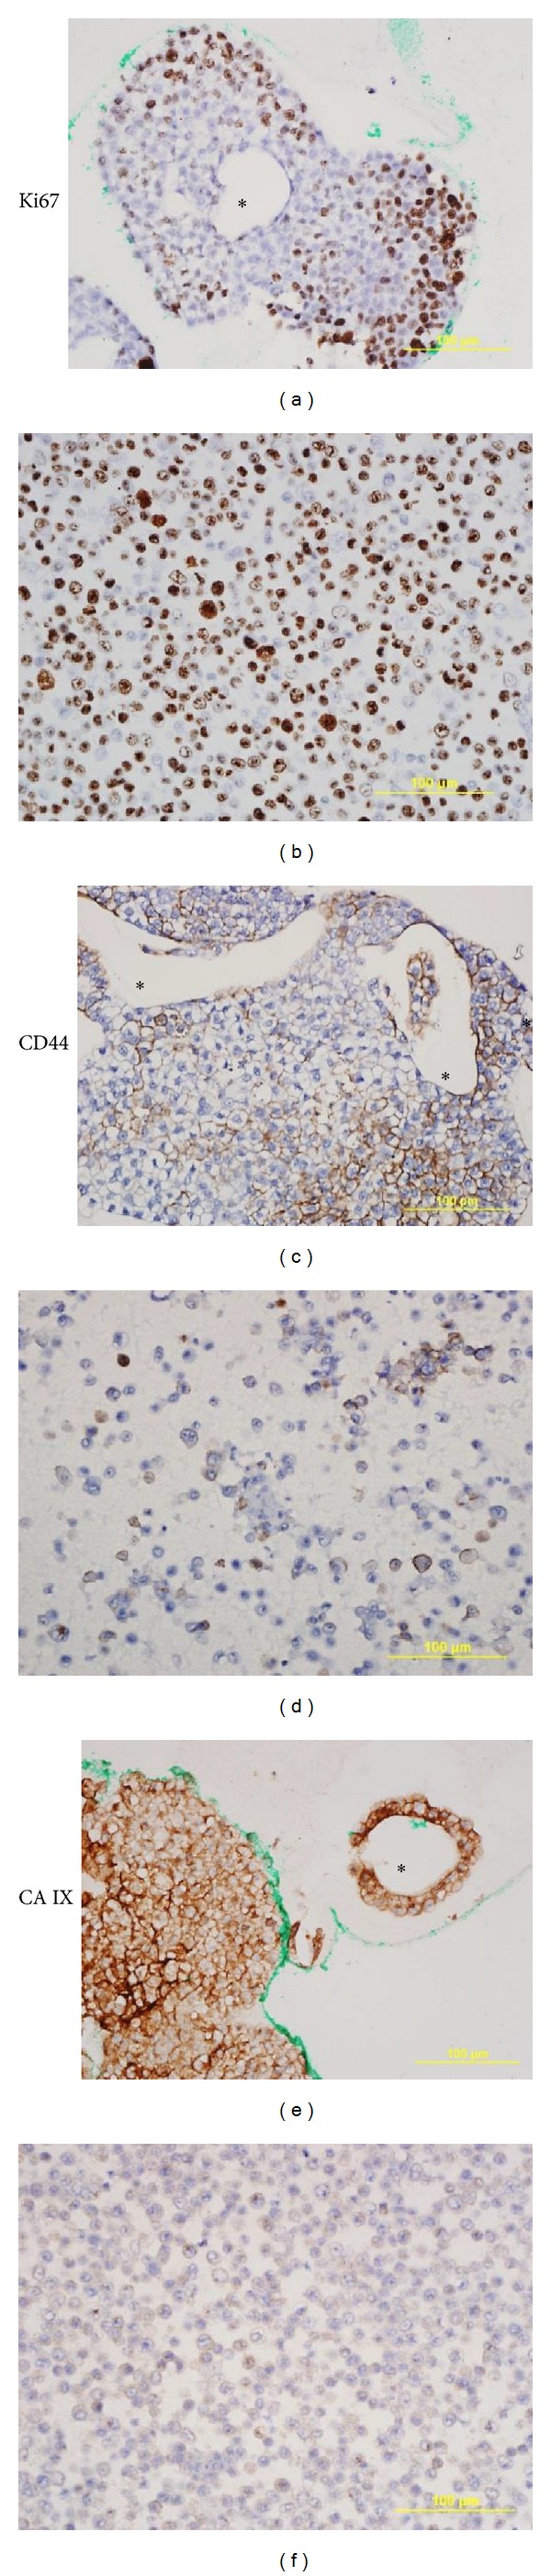
Background. Human cancer is a three-dimensional (3D) structure consisting of neighboring cells, extracellular matrix, and blood vessels. It is therefore critical to mimic the cancer cells and their surrounding environment during in vitro study. Our aim was to establish a 3D cancer model using a synthetic composite scaffold. Methods. High-density low-volume seeding was used to promote attachment of a non-small-cell lung cancer cell line (NCI-H460) to scaffolds. Growth patterns in 3D culture were compared with those of monolayers. Immunohistochemistry was conducted to compare the expression of Ki67, CD44, and carbonic anhydrase IX. Results. NCI-H460 readily attached to the scaffold without surface pretreatment at a rate of 35% from a load of 1.5 × 10(6) cells. Most cells grew vertically to form clumps along the surface of the scaffold, and cell morphology resembled tissue origin; 2D cultures exhibited characteristics of adherent epithelial cancer cell lines. Expression patterns of Ki67, CD44, and CA IX varied markedly between 3D and monolayer cultures. Conclusions. The behavior of cancer cells in our 3D model is similar to tumor growth in vivo. This model will provide the basis for future study using 3D cancer culture.


Figures

Figure 1
Figure 1
Microscopic image of the monolayer culture of NCI-H460 cells in 5% RPMI1640 after 24 hours incubation in 6-well plates.
Figure 2
Figure 2
NCI-H460 cell number counted at day 4 of scaffold culture with 3 × 10⁵ (dark grey), 7 × 10⁵ (light grey) and 1.5 × 10⁶ (grey) as initial seeding cell number for 1-2 hours, 4 hours and 24 hours. There is a significant difference between 1-2 hours and 4 hours seeding; *P < 0.05, **P < 0.01.
Figure 3
Figure 3
The photo images of scaffold cultures shown above are stained with methylene blue on day 1 (left panel) and day 3 (right panel) the two panels of each day show the scaffold culture seeded with 1 × 10⁵ and 1 × 10⁶ cells, respectively. Scale bars are 1 mm.
Figure 4
Figure 4
The top row shows light microscope images of NCI-H460 3D culture. (a) (Day 1) demonstrates cells (shown by arrows) that surround the scaffold (dark-shaded areas). This can be compared to (b), which shows that at day 14 multilayers of cells cover the scaffold. The bottom row shows images of H&E staining on paraffin sections of 3D culture after 1 week in culture. (c) shows the complete cross section of a scaffold with most of the large clumps located peripherally (magnification 4x). (d) is an example of a big cluster more than 500 μm in diameter, including a nonviable cell centre region (shown by arrow). The clear region that is marked with an asterisk (∗) shows the location of the scaffold that dissolved in xylene (magnification 20x). Scale bars are (a) 100 μm, (b) 200 μm, (c) 1 mm, and (d) 200 μm.
Figure 5
Figure 5
(a) Illustration of three types of growth pattern on the scaffolds. (b) to (c) showing the identical microscopic view under light (left panel) and fluorescent filters (right panel); (b) an example of form A growth; (c) an example of form (b) and (c) vertical growth; (d) large cell clumps detached from scaffold grow as tumour spheroid. Scale bars are (b) and (c) = 50 μm, (d) = 200 μm.
Figure 6
Figure 6
Cell proliferation measured at day 1 (dark grey), day 3 (light grey), and day 7 (grey) by MTT assay with different seeding numbers for 1-2 hours initial seeding time. The data are generated on three individual experiments with triplicate, normalised with standard curve.
Figure 7
Figure 7
The images are representative of immunohistochemistry staining of nuclear staining of proliferation marker Ki67, membrane protein CD 44, and CA IX. The images of scaffold culture (left panel) are compared with cell pellet paraffin section (right panel). The scaffold dissolved in xylene presented as a clear region marked ∗. All scale bars are 100 μm, magnification 40x.

Similar articles

Cited by

References

    1. Hutmacher DW, Loessner D, Rizzi S, Kaplan DL, Mooney DJ, Clements JA. Can tissue engineering concepts advance tumor biology research? Trends in Biotechnology. 2010;28(3):125–133. - PubMed
    1. Zhang S. Beyond the Petri dish. Nature Biotechnology. 2004;22(2):151–152. - PubMed
    1. Lutolf MP, Gilbert PM, Blau HM. Designing materials to direct stem-cell fate. Nature. 2009;462(7272):433–441. - PMC - PubMed
    1. Yamada KM, Cukierman E. Modeling tissue morphogenesis and cancer in 3D. Cell. 2007;130(4):601–610. - PubMed
    1. Benton G, George J, Kleinman HK, Arnaoutova IP. Advancing science and technology via 3D culture on basement membrane matrix. Journal of Cellular Physiology. 2009;221(1):18–25. - PubMed

LinkOut - more resources