Pulse pressure variation and stroke volume variation to predict fluid responsiveness in patients undergoing carotid endarterectomy
- PMID: 24101958
- PMCID: PMC3790035
- DOI: 10.4097/kjae.2013.65.3.237
Pulse pressure variation and stroke volume variation to predict fluid responsiveness in patients undergoing carotid endarterectomy
Abstract
Background: During carotid endarterectomy (CEA), hemodynamic stability and adequate fluid management are crucial to prevent perioperative cerebral stroke, myocardial infarction and hyperperfusion syndrome. Both pulse pressure variation (PPV) and stroke volume variation (SVV), dynamic preload indices derived from the arterial waveform, are increasingly advocated as predictors of fluid responsiveness in mechanically ventilated patients. The aim of this study was to evaluate the accuracy of PPV and SVV for predicting fluid responsiveness in patients undergoing CEA.
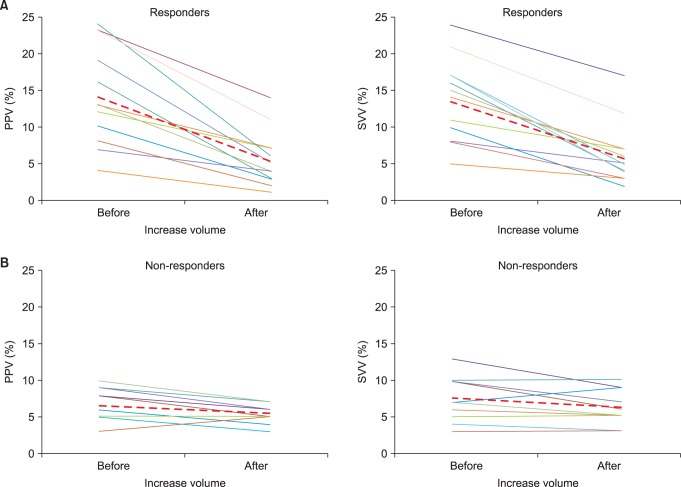
Methods: Twenty seven patients undergoing CEA were enrolled in this study. PPV, SVV and cardiac output (CO) were measured before and after fluid loading of 500 ml of hydroxyethyl starch solution. Fluid responsiveness was defined as an increase in CO ≥ 15%. The ability of PPV and SVV to predict fluid responsiveness was assessed using receiver operating characteristic (ROC) analysis.
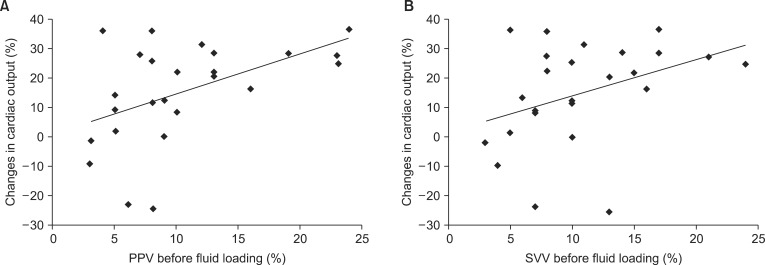
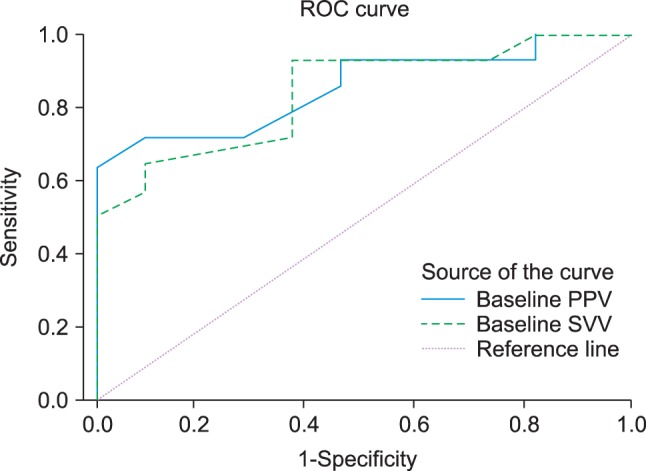
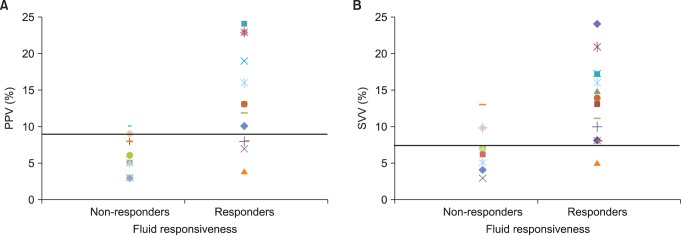
Results: Both PPV and SVV measured before fluid loading are associated with changes in CO caused by fluid expansion. The ROC analysis showed that PPV and SVV predicted response to volume loading (area under the ROC curve = 0.854 and 0.841, respectively, P < 0.05). A PPV ≥ 9.5% identified responders (Rs) with a sensitivity of 71.4% and a specificity of 90.9%, and a SVV ≥ 7.5% identified Rs with a sensitivity of 92.9% and a specificity of 63.6%.
Conclusions: Both PPV and SVV values before volume loading are associated with increased CO in response to volume expansion. Therefore, PPV and SVV are useful predictors of fluid responsiveness in patients undergoing CEA.
Keywords: Arterial blood pressure; Cardiac output; Carotid endarterectomy; Fluid therapy; Stroke volume.
Figures
References
-
- Ederle J, Dobson J, Featherstone RL, Bonati LH, van der Worp HB, de Borst GJ, et al. Carotid artery stenting compared with endarterectomy in patients with symptomatic carotid stenosis (International Carotid Stenting Study): an interim analysis of a randomised controlled trial. Lancet. 2010;375:985–997. - PMC - PubMed
-
- Wilke HJ, 2nd, Ellis JE, McKinsey JF. Carotid endarterectomy: perioperative and anesthetic considerations. J Cardiothorac Vasc Anesth. 1996;10:928–949. - PubMed
-
- Kumar A, Anel R, Bunnell E, Habet K, Zanotti S, Marshall S, et al. Pulmonary artery occlusion pressure and central venous pressure fail to predict ventricular filling volume, cardiac performance, or the response to volume infusion in normal subjects. Crit Care Med. 2004;32:691–699. - PubMed
-
- Michard F, Boussat S, Chemla D, Anguel N, Mercat A, Lecarpentier Y, et al. Relation between respiratory changes in arterial pulse pressure and fluid responsiveness in septic patients with acute circulatory failure. Am J Respir Crit Care Med. 2000;162:134–138. - PubMed
-
- Michard F, Teboul JL. Predicting fluid responsiveness in ICU patients: a critical analysis of the evidence. Chest. 2002;121:2000–2008. - PubMed
LinkOut - more resources
Full Text Sources
Other Literature Sources