. 2014 Jan;68(1):16-31.
doi: 10.1111/evo.12259. Epub 2013 Sep 16.

Strong selection genome-wide enhances fitness trade-offs across environments and episodes of selection

Affiliations

Strong selection genome-wide enhances fitness trade-offs across environments and episodes of selection

Jill T Anderson et al. Evolution. 2014 Jan.

Abstract

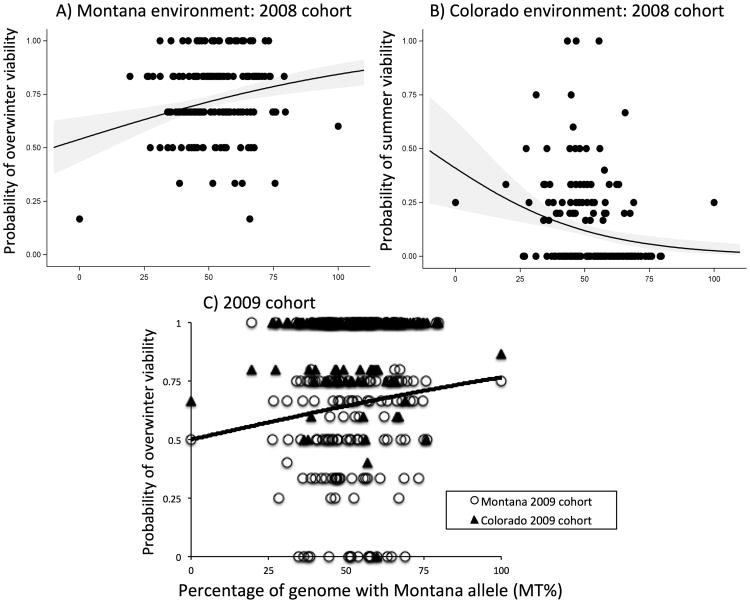
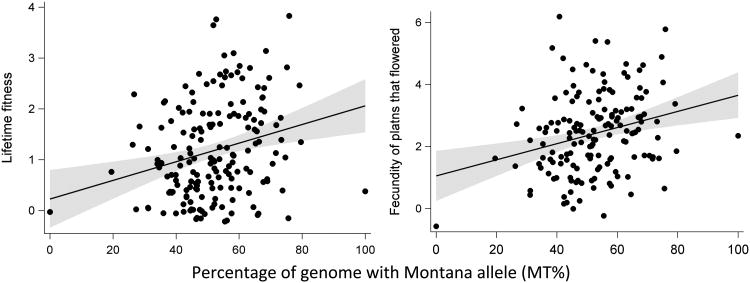
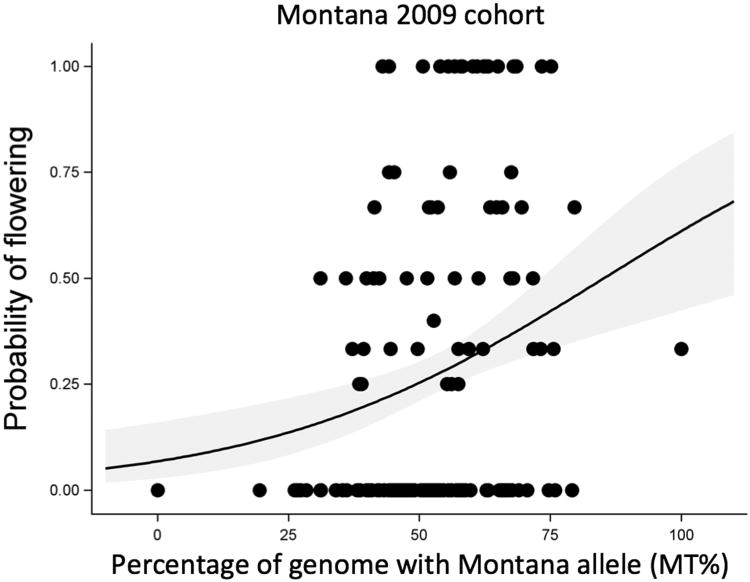
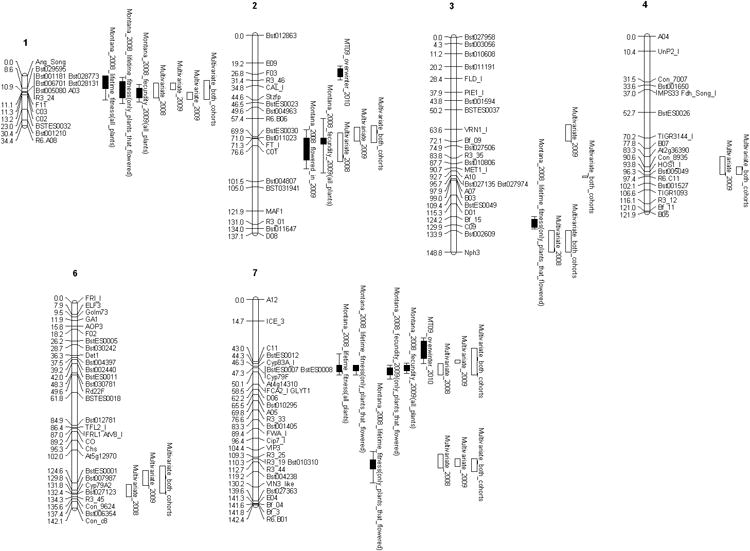
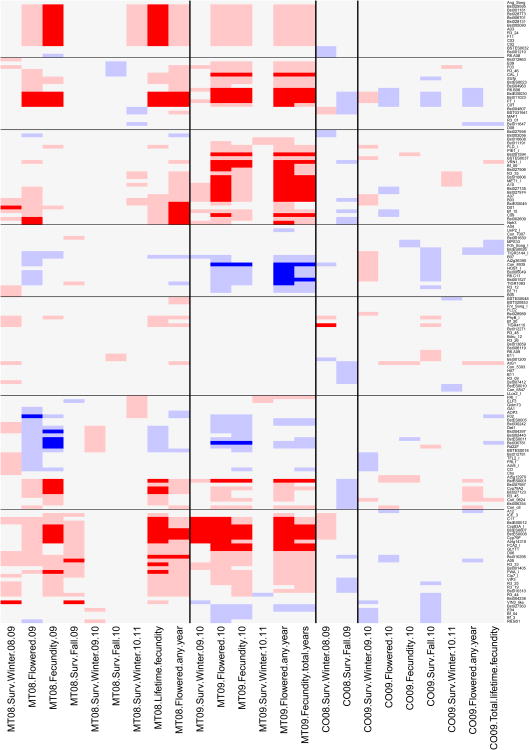
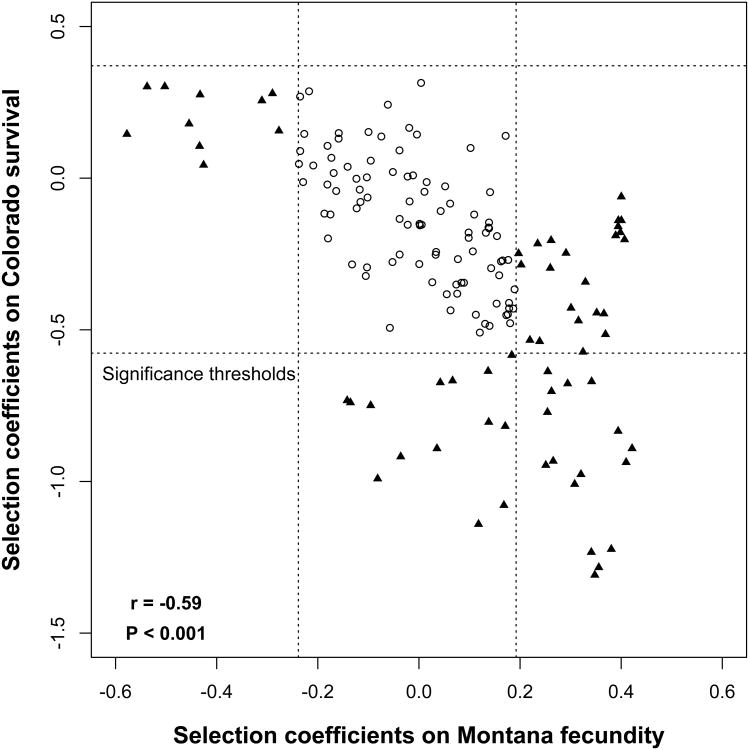
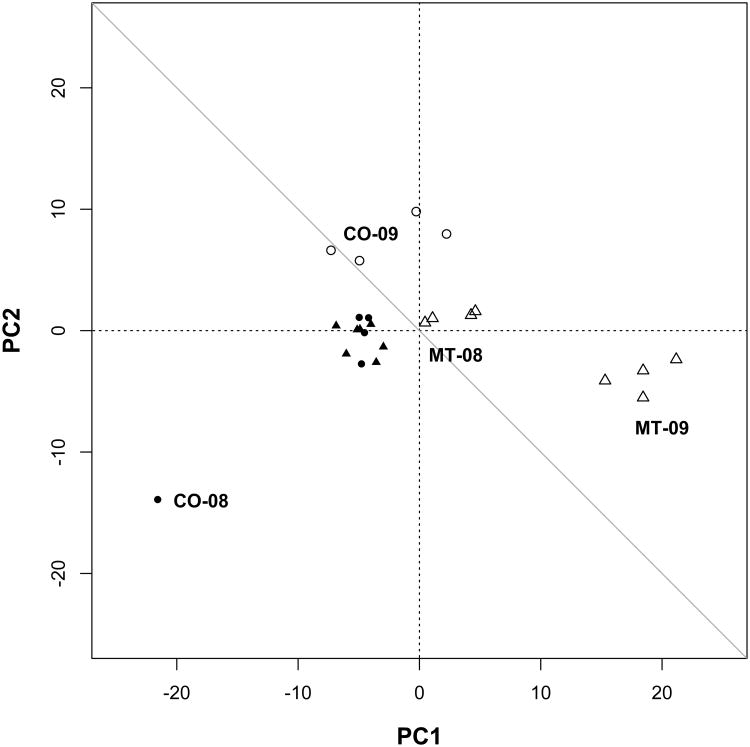
Fitness trade-offs across episodes of selection and environments influence life-history evolution and adaptive population divergence. Documenting these trade-offs remains challenging as selection can vary in magnitude and direction through time and space. Here, we evaluate fitness trade-offs at the levels of the whole organism and the quantitative trait locus (QTL) in a multiyear field study of Boechera stricta (Brassicaceae), a genetically tractable mustard native to the Rocky Mountains. Reciprocal local adaptation was pronounced for viability, but not for reproductive components of fitness. Instead, local genomes had a fecundity advantage only in the high latitude garden. By estimating realized selection coefficients from individual-level data on viability and reproductive success and permuting the data to infer significance, we examined the genetic basis of fitness trade-offs. This analytical approach (Conditional Neutrality-Antagonistic Pleiotropy, CNAP) identified genetic trade-offs at a flowering phenology QTL (costs of adaptation) and revealed genetic trade-offs across fitness components (costs of reproduction). These patterns would not have emerged from traditional ANOVA-based QTL mapping. Our analytical framework can be applied to other systems to investigate fitness trade-offs. This task is becoming increasingly important as climate change may alter fitness landscapes, potentially disrupting fitness trade-offs that took many generations to evolve.

Keywords: Antagonistic pleiotropy; conditional neutrality; ecological genetics; evolutionary constraints; fitness components; local adaptation.


Figures

Figure 1
Figure 1
Genotype by environment interactions for viability components of fitness in 172 F6 Recombinant Inbred Lines and two parental lines planted into the parental environments in the 2008 cohort. Results in both environments reflect local adaptation for the 2008 cohort. (A) In Montana, overwinter viability improves as a function of the percentage of the genome with Montana alleles (MT%). (B) In Colorado, summer viability declined with increasing MT%. (C) For the 2009 cohort, overwinter viability increased with MT% in both environments, suggesting local maladaptation in Colorado. In panel C, open circles represent families in the Montana environment and filled triangles represent families in the Colorado environment. Logistic regressions were conducted with family level data.
Figure 2
Figure 2
Fecundity components of fitness increase as a function of the percentage of the genome with Montana alleles (MT%) for the 2008 Montana cohort. We found no relationship between the number of fruits and MT% in the 2009 cohort for either environment.
Figure 3
Figure 3. Success of local genomes via the probability of flowering in Montana
Flowering success increases with MT% in Montana. Data points represent family means for the Montana 2009 cohort. We found no evidence that flowering success declines with MT% in Colorado.
Figure 4
Figure 4. Quantitative trait loci (QTL) for fitness components
Positions of quantitative trait loci detected by univariate analysis (black boxes) and multivariate analysis (open boxes). The 1 and 2 LOD confidence intervals are indicated by the box and bars, respectively for univariate QTL. The open bars indicate confidence intervals in multivariate mapping. We found no QTL on linkage group 5 (not pictured here).
Figure 5
Figure 5. Heatmap of significant QTL for fitness components
Rows show results for each molecular marker, and columns indicate individual episodes of selection. Sites and cohorts are separated by black vertical lines, and chromosomes are delimited by horizontal black lines. Marker names and fitness components are indicated along the right and bottom margins, respectively. For the fitness components, sites and cohorts are represented by state codes and two number years (e.g., MT08 is Montana 2008 cohort). Surv.Winter is overwinter survivorship, flowered is the probability of flowering, fecundity is the number of fruits, Surv.Fall indicates growing season survivorship. Non-significant selection coefficients are in light gray. Dark red (dark blue) indicates selection favoring the Montana (Colorado) allele, with significance based on the genome-wide threshold. Light red (light blue) indicates selection favoring the Montana (Colorado) allele, with significance based on the per-locus threshold. See text for details.
Figure 6
Figure 6. Genome-wide correlation between selection coefficients in Montana and Colorado
These two episodes of selection in the 2008 cohort compare first summer fruit production in Montana (“MT fecundity”) and first summer survival in Colorado (“CO survival”). Plotted are pairwise correlations of selection coefficients at all markers, including non-significant loci. Black triangles indicate significant markers in one or more environments. White circles show loci below the significance thresholds, which are indicated by dotted lines. Significance thresholds are determined by CNAP permutation (see Methods for details).
Figure 7
Figure 7. Patterns of genome-wide selection coefficients for multiple episodes of selection
Episodes of viability selection are indicated by filled symbols and reproductive selection components are open symbols for Montana (triangles) and Colorado (circles). Except for the unusual selection pressures on summer survival in Colorado 2008 (extreme lower left), other episodes of viability selection show similar patterns in both sites (closed cluster near center). Selection coefficients for reproductive components of fitness (at or above the diagonal) are labeled for each site and cohort. PC1 and PC2 account for 58.5% and 13.8% of total variation, respectively.

References

    1. Anderson JT, Geber MA. Demographic Source-Sink Dynamics Restrict Local Adaptation in Elliott's Blueberry (Vaccinium Elliottii) Evolution. 2010;64:370–384. - PubMed
    1. Anderson JT, Lee CR, Rushworth C, Colautti R, Mitchell-Olds T. Genetic tradeoffs and conditional neutrality contribute to local adaptation. Molecular Ecology. 2013;22:699–708. - PMC - PubMed
    1. Anderson JT, Lee CR, Mitchell-Olds T. Life-History QTLs and natural selection on flowering time in Boechera stricta, a perennial relative of Arabidopsis. Evolution. 2011;65:771–787. - PMC - PubMed
    1. Bennington C, Fetcher N, Vavrek M, Shaver G, Cummings K, McGraw J. Home site advantage in two long-lived arctic plant species: results from two 30-year reciprocal transplant studies. Journal of Ecology. 2012;100:841–851.
    1. Brunelle A, Whitlock C, Bartlein P, Kipfmueller K. Holocene fire and vegetation along environmental gradients in the Northern Rocky Mountains. Quaternary Science Reviews. 2005;24:2281–2300.