

New dynamics in global obesity facing low- and middle-income countries
- PMID: 24102717
- PMCID: PMC4074506
- DOI: 10.1111/obr.12102
New dynamics in global obesity facing low- and middle-income countries
Abstract
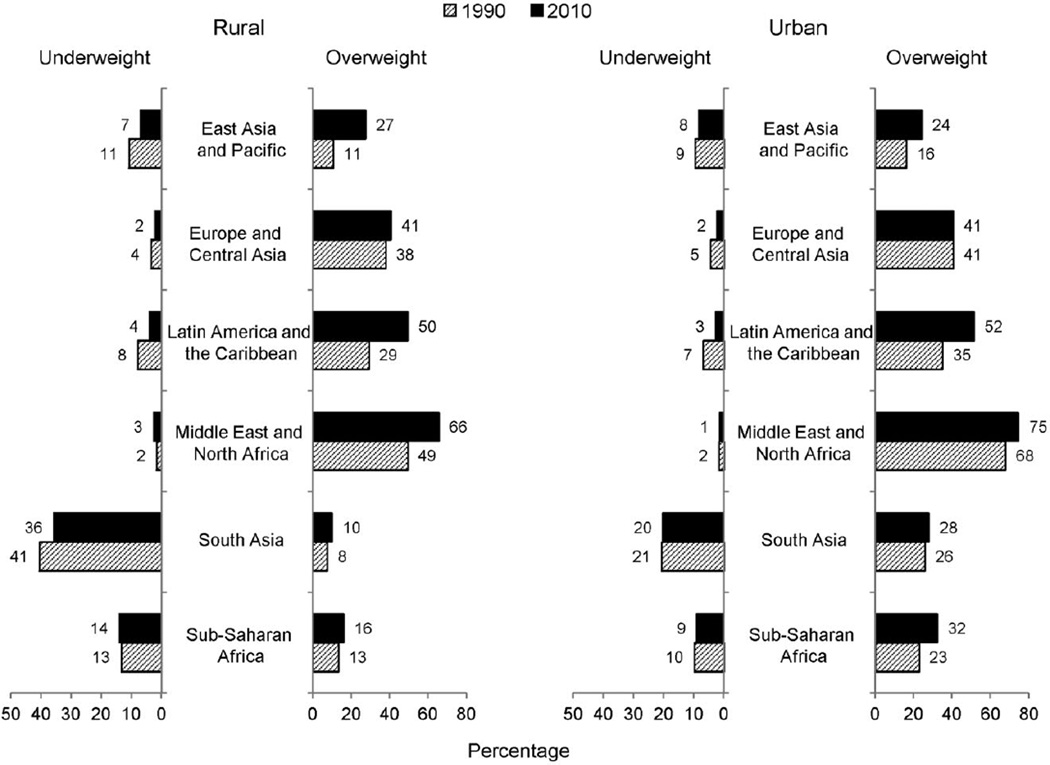
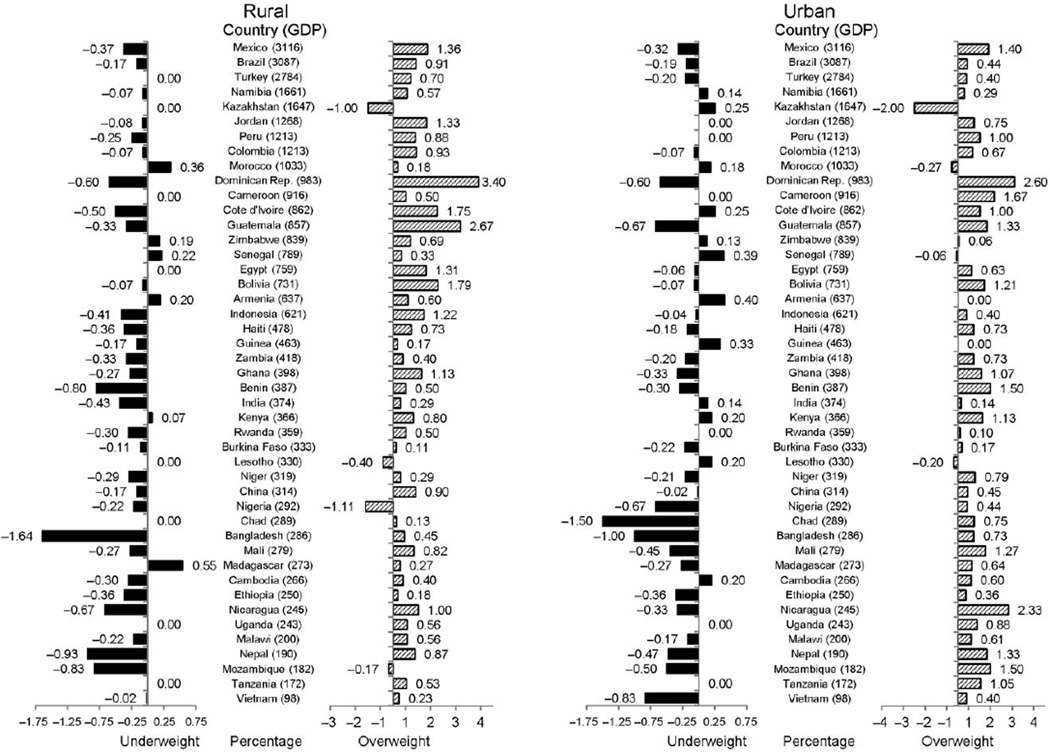
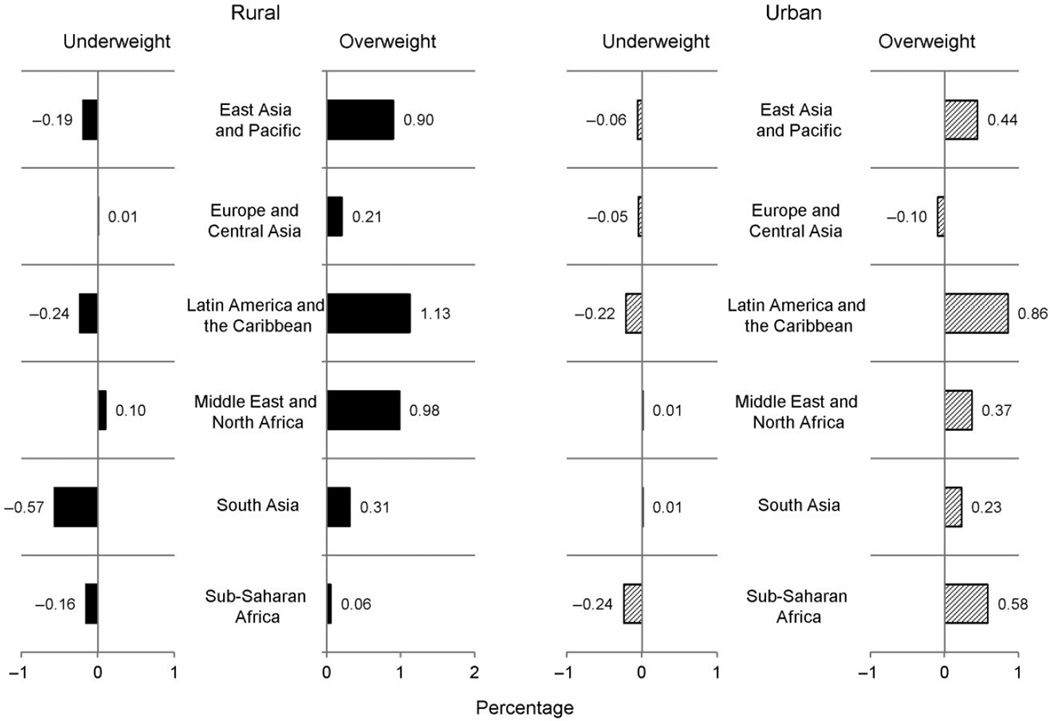
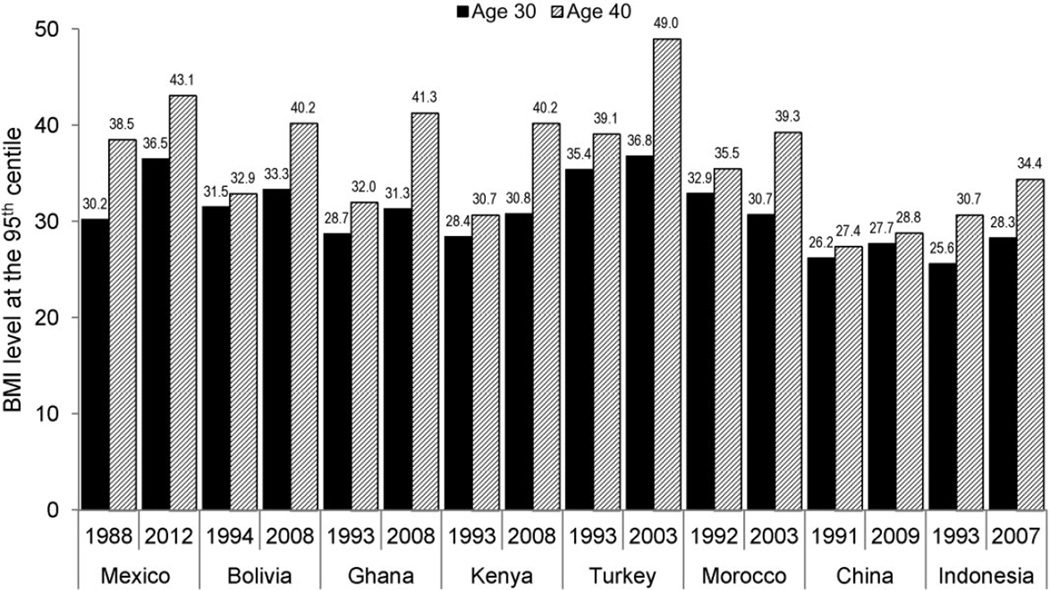
Levels of overweight and obesity across low- and middle-income countries (LMIC) have approached levels found in higher-income countries. This is particularly true in the Middle East and North Africa and in Latin America and the Caribbean. Using nationally representative samples of women aged 19-49, n = 815,609, this paper documents the annualized rate of increase of overweight from the first survey in early 1990 to the last survey in the present millennium. Overweight increases ranged from 0.31% per year to 0.92% per year for Latin America and the Caribbean and for the Middle East and North Africa, respectively. For a sample of eight countries, using quantile regression, we further demonstrate that mean body mass index (BMI) at the 95th percentile has increased significantly across all regions, representing predicted weight increases of 5-10 kg. Furthermore we highlight a major new concern in LMICs, documenting waist circumference increases of 2-4 cm at the same BMI (e.g. 25) over an 18-year period. In sum, this paper indicates growing potential for increased cardiometabolic problems linked with a large rightward shift in the BMI distribution and increased waist circumference at each BMI level.
Keywords: Low- and middle-income countries; obesity prevalence; obesity trends; waist circumference.
© 2013 The Authors. Obesity Reviews published by John Wiley & Sons Ltd on behalf of the International Association for the Study of Obesity.
Conflict of interest statement
None.
Figures

References
-
- von Braun J, Ahmed A, Asenso-Okyere K, et al. High food prices: the what, who, and how of proposed policy actions. In: IFPRI, editor. Policy Brief. Washington DC: IFPRI; 2008. pp. 1–18.
-
- Albrecht S, Barquera S, Rivera J, Popkin B. Secular changes in obesity phenotype in Mexican origin populations: a comparative analysis of Mexico and the U.S. 2013.
-
- Popkin B, Albrecht S, Stern D, Gordon-Larsen P, Adair L. Secular changes in obesity-waist circumference patterns: China, Mexico, the United Kingdom and the United States. 2013
-
- DHS M, editor. ICF International. Measure DHS: Demographic and Health Surveys. 2013.
Publication types
MeSH terms
Grants and funding
LinkOut - more resources
Full Text Sources
Other Literature Sources
Medical
