. 2013 Nov;13(11):3010-20.
doi: 10.1111/ajt.12433. Epub 2013 Sep 18.

Clinical grade manufacturing of human alloantigen-reactive regulatory T cells for use in transplantation

Affiliations

Clinical grade manufacturing of human alloantigen-reactive regulatory T cells for use in transplantation

A L Putnam et al. Am J Transplant. 2013 Nov.

Abstract

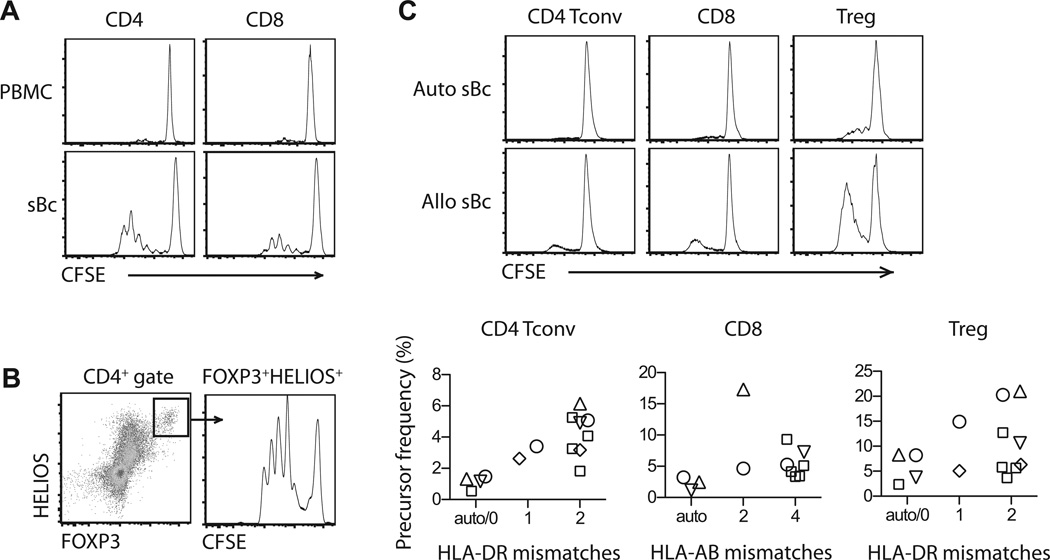
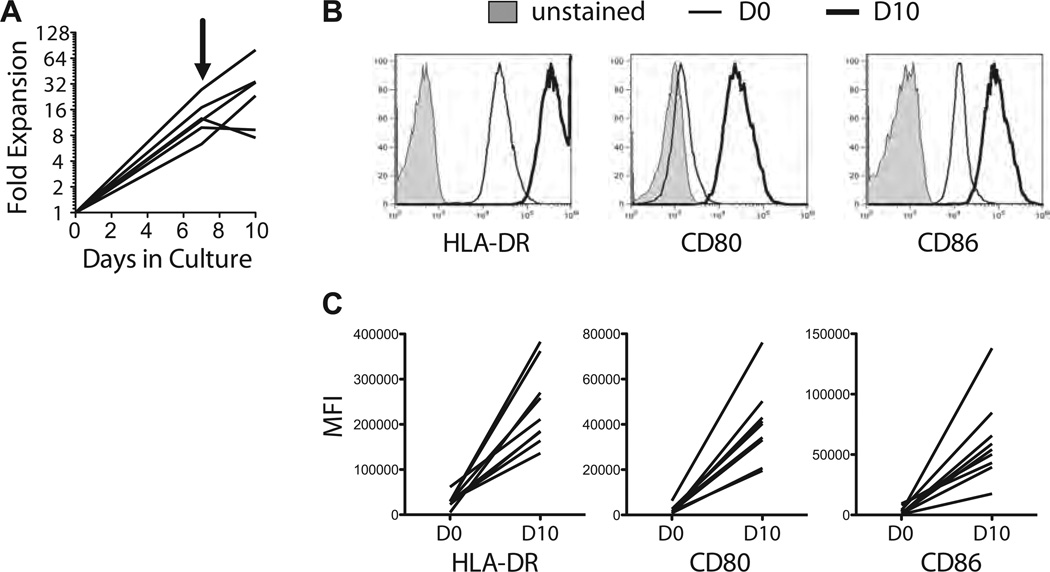
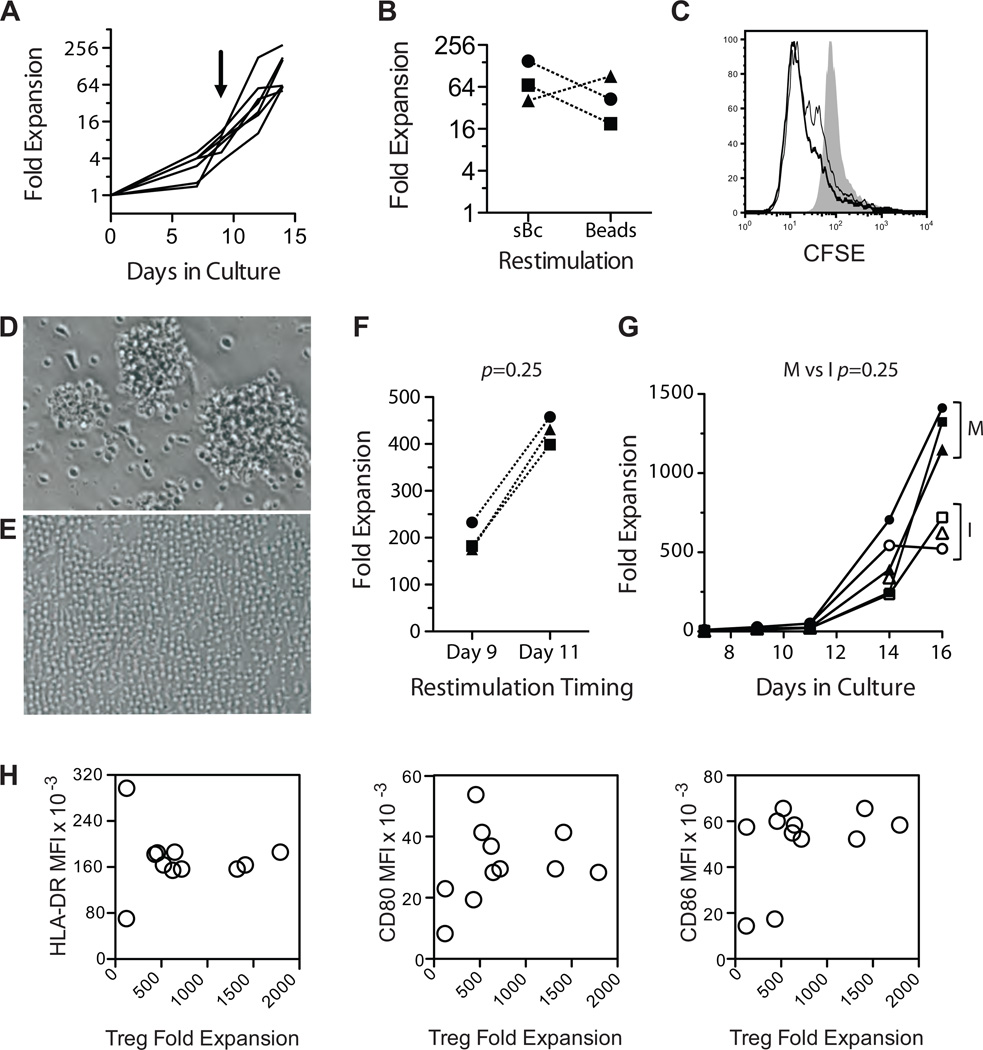
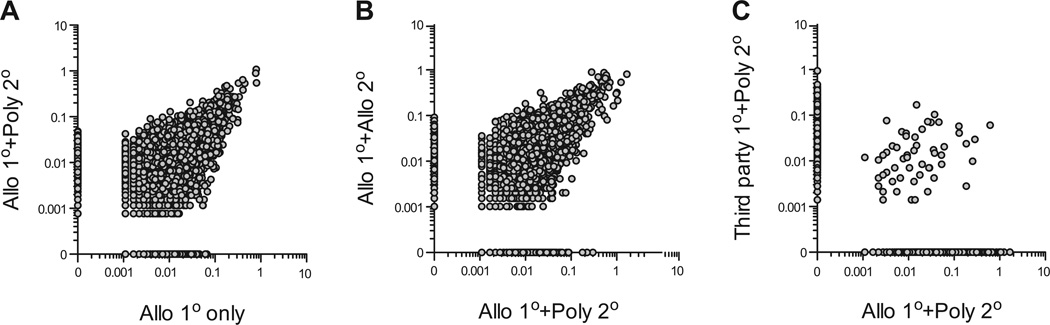
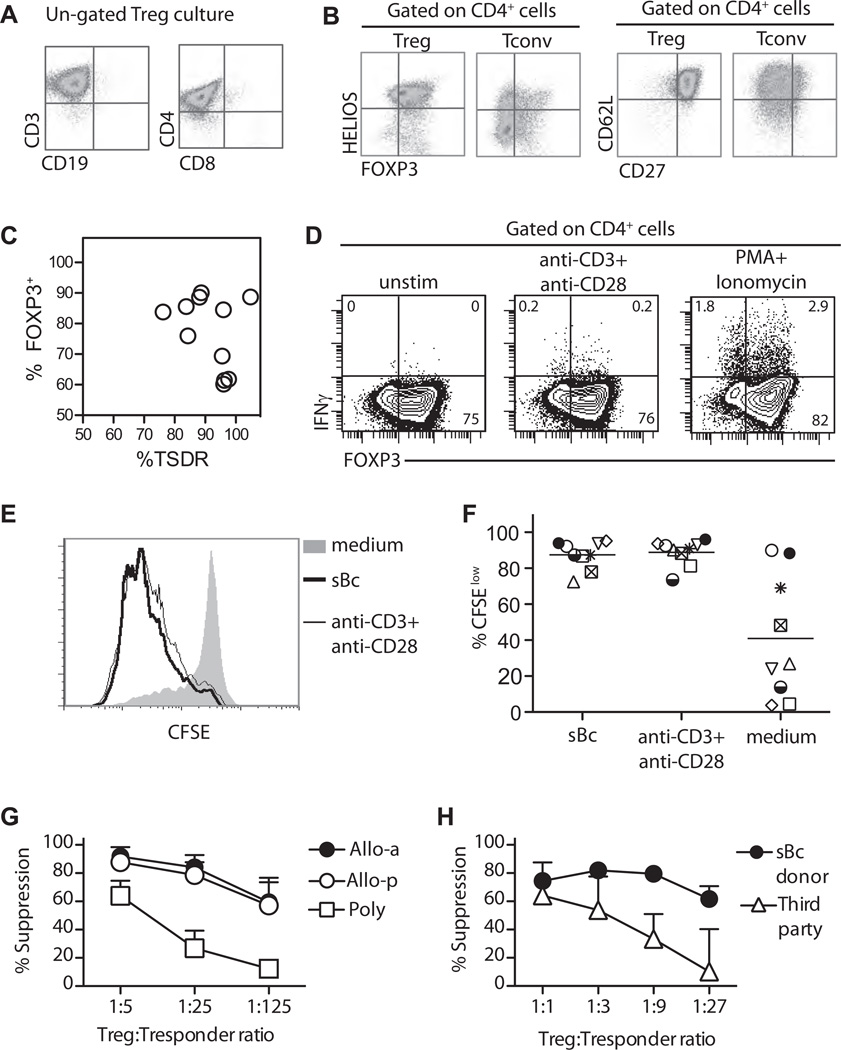
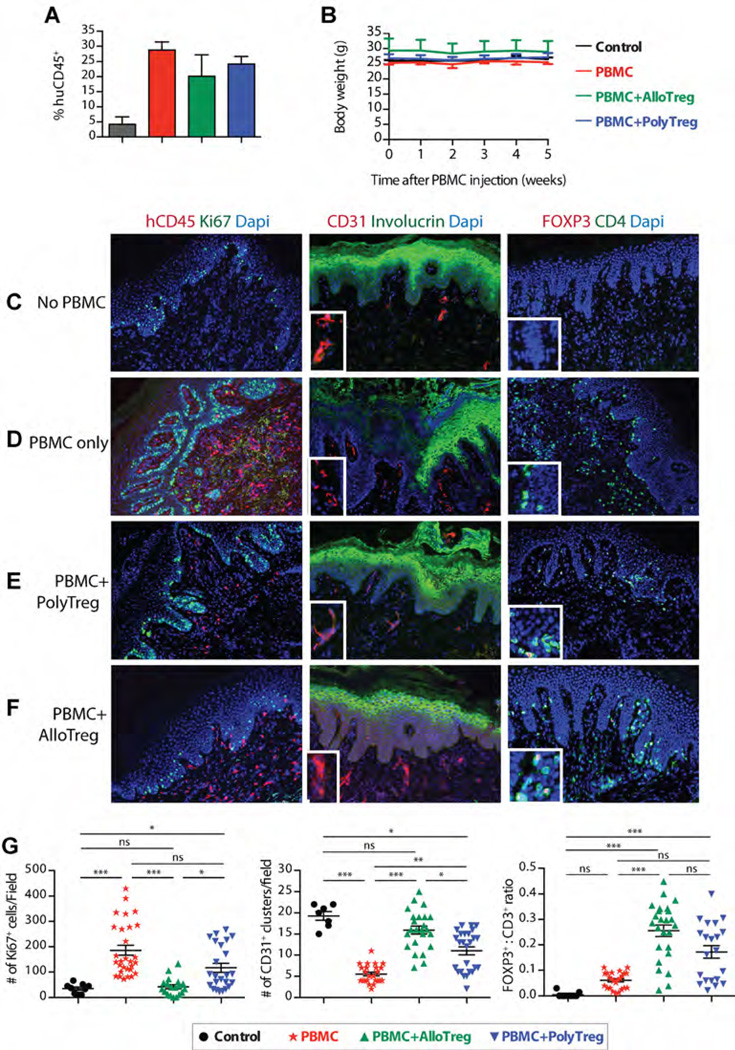
Regulatory T cell (Treg) therapy has the potential to induce transplantation tolerance so that immunosuppression and associated morbidity can be minimized. Alloantigen-reactive Tregs (arTregs) are more effective at preventing graft rejection than polyclonally expanded Tregs (PolyTregs) in murine models. We have developed a manufacturing process to expand human arTregs in short-term cultures using good manufacturing practice-compliant reagents. This process uses CD40L-activated allogeneic B cells to selectively expand arTregs followed by polyclonal restimulation to increase yield. Tregs expanded 100- to 1600-fold were highly alloantigen reactive and expressed the phenotype of stable Tregs. The alloantigen-expanded Tregs had a diverse TCR repertoire. They were more potent than PolyTregs in vitro and more effective at controlling allograft injuries in vivo in a humanized mouse model.

Keywords: Cellular therapy; clinical application; regulatory T cells; tolerance induction.


Conflict of interest statement

Disclosure

The authors of this manuscript have conflicts of interests to disclose as described by the American Journal of Transplantation. JAB and QT are co-inventors on two patents on regulatory T cell therapy. JAB has received reagents and equipment from BD Biosciences in support of developing regulatory T cell therapy.

Figures

Figure 1
Figure 1. CD40L-sBc potently stimulate T cell proliferation
(A and B) PBMC and CD40L-sBc from the same donor were compared for their ability to stimulate proliferation of alloreactive T cells in a one-way MLR. The responder PBMCs were labeled with CFSE before MLR and the cultures were harvested on day 4 for flow cytometric analysis. Representative CFSE dilution profiles of CD4+ and CD8+ T cells (A) and CD4+FOXP3+HELIOS+ Tregs (B) are shown. The data are a representative of at least 10 independent experiments. (C) Autologous CD40L-sBc and allogeneic CD40L-sBc with different degree of HLA mismatches with responder cells were compared in their ability to stimulation proliferation of CD4+ Tconv, CD8+ T cells and Treg cells. Each symbol represents the same responder. Results area summary of 15 different stimulator and responder combinations. CD40L-sBc, CD40L-stimulated B cells; CFSE, carboxyfluorescein succinimidyl ester; MLR, mixed lymphocyte reaction; PBMC, peripheral blood mononuclear cell; Tconv, conventional CD4+ T cells; Treg, regulatory T cell.
Figure 2
Figure 2. Generation of CD40L-sBc using K-CD40L cells
(A) The expansion of purified B cells in the 10-day culture is shown. The arrow indicates the time of restimulation. (B and C) Expression of HLA-DR, CD80, and CD86 in freshly isolated B cells and day 10 CD40L-sBc was compared using flow cytometry. Sample overlay histograms are shown in (B), and charts summarizing results from independent experiments are shown in (C). The data are summary of six independent experiments. CD40L-sBc, CD40L-stimulated B cells; K-CD40L, CD40L-expressing cell line; KT64.CD40L.HLADR0401; MFI, mean fluorescence intensity.
Figure 3
Figure 3. Selective expansion of arTregs using CD40L-sBc
(A)Allogeneic sBc were used to stimulate FACS purified Tregs on days 0 and 9. Fold expansion of Treg in the 14-day culture in six independent experiments is shown. The arrow indicates the time of restimulation. (B) Tregs were stimulated with CD40L-sBc for 9 days and then the cultures were split with half restimulated with CD40L-sBc from the same donor and the other half with anti-CD3 and anti-CD28-coated beads. Fold expansion on day 14 of three independent paired cultures is shown (p=0.75, Wilcoxon matched-pairs signed rank test). (C) Alloreactivity of expanded Tregs was determined by labeling the expanded Tregs with CFSE before restimulation with the same CD40L-sBc used for expansion (thick line), anti-CD3 and anti-CD28-coated beads (thin line) or syngeneic CD40L-sBc (shaded histogram). (D and E) Appearances of Treg cultures on days 9 (D) and 11 (E) after primary stimulation are shown. Data represent results from at least 10 independent cultures. (F) Tregs were stimulated with CD40L-sBc for 9 or 11 days before restimulation with anti-CD3 and anti-CD28-coated beads. The cultures were harvested 5 days after restimulation, and total fold expansions in three paired cultures were compared (p = 0.25, Wilcoxon matched-pairs signed rank test). (G) Tregs were stimulated with CD40L-sBc for 11 days before restimulation with anti-CD3 and anti-CD28-coated beads from Invitrogen (open symbols) or Miltenyi Biotec (closed symbols). Cell expansions over time in three paired cultures are shown. Wilcoxon matched-pairs signed rank test was used to compare the difference in total fold expansion on day 16 (p = 0.25). (H) XY scatterplots showing a correlation of arTreg expansion and mean fluorescence intensity (MFI) of HLA-DR, CD80 and CD86 expressed on different CD40L-sBc preparations. The data are a summary of 11 independent arTreg cultures. arTregs, arTreg, alloantigen-reactive Tregs; CD40L-sBc, CD40L-stimulated B cells; CFSE, carboxyfluorescein succinimidyl ester; FACS, fluorescence activated cell sorting; Tregs, regulatory T cells.
Figure 4
Figure 4. Treg TCR repertoire analyses using high-throughput TCR β chain sequencing
(A) An xy scatterplot was used to compare TCR β chain usage by Tregs after primary CD40L-sBc (Allo) stimulation (x-axis) or after CD40L-sBc (Allo) stimulation and anti-CD3/28 bead (Poly) restimulation (y-axis), showing 85% similarity between the two samples. Each circle represent one unique TCR β chain nucleotide sequence, and data points on the x- and y-axis are present in one sample but absent in the other. The data represent results from two independent experiments. (B) An xy scatterplot was used to compare TCR β chain usage by Tregs after primary CD40L-sBc stimulation and anti-CD3/CD28 bead restimulations (x-axis) and after two rounds of alloantigen stimulations (y-axis) showing 93% similarity between the two samples. The data represent results from two independent experiments. (C) Tregs purified from one donor was split into two equal parts and subjected to primary stimulation with CD40L-sBc from two different allogeneic B cell donors (Allo and Third party) followed by polyclonal restimulation. A comparison of TCR β chain usage by the two arTreg preparations showed 2% overlap. similarity CD40L-sBc, CD40L-stimulated B cells; Treg, regulatory T cell.
Figure 5
Figure 5. Phenotype, alloantigen reactivity, and in vitro function of Tregs expanded with CD40L-sBc
(A and B) Flow cytometric profiles of ungated (A) and CD4 gated (B) Treg cultures. Data are representative of at least 14 independent experiments. (C) Correlation between percentages of demethylated TSDR and FOXP3 from 11 independent cultures. (D) IFN-γ expression by arTregs after 4 h in vitro stimulation as indicated. (E) Alloreactivity of Tregs expanded with primary allogeneic sBc stimulation and polyclonal restimulation on day 11 was determined as described in Figure 3B. An example of overlay histogram is shown. (F) A summary of seven independent cultures analyzed as described in (C) is shown. Each symbol represents one independent Treg culture. (G) A summary of in vitro suppression by Tregs expanded with two rounds of stimulation with allogeneic CD40L-sBc (closed circles, Allo-a, n = 3), allogeneic sBc primary stimulation followed by polyclonal restimulation (open circles, Allo-p, n = 8), or two rounds of polyclonal stimulations (open squares, Poly, n = 5) is shown. Responders are PBMC from the Treg donor, and stimulators are PBMC from the sBc donor. Data shown are mean ± SEM suppression observed in three to eight independent experiments. Two-way analysis of variance (ANOVA) with Bonferroni multiple comparison test was used to determine the statistical significance of the differences. Suppression at 1:5 ratio by different groups of Tregs is not significantly different. Suppression by PolyTregs is significantly lower when compared to Allo-a Tregs (p < 0.001 at 1:25 ratio and p < 0.01 at 1:125 ratio), or when compared to Allo-p Tregs (p < 0.0001 at 1:25 ratio and p < 0.001 at 1:125 ratio). Allo-a and Allo-p Tregs are not significantly different from each other at all ratios. (H) Suppression by CD40L-sBc expanded Tregs stimulated by PBMC from the sBc donors (closed circles) or third-party donors (open triangles) is shown. Data shown are mean±SEM suppression observed in six independent experiments. Two-way ANOVA with Bonferroni multiple comparison test was used to determine the statistical significance of the differences. Suppression at 1:1 and 1:3 ratios stimulated by sBc and third-party donors is not significantly different. Suppression stimulated by sBc donor at 1:9 and 1:27 ratios is significantly lower when compared to that stimulated by third-party donors (p < 0.001 at 1:9 ratio and p < 0.001 at 1:27 ratio). arTregs, arTreg, alloantigen-reactive Tregs; CD40L-sBc, CD40L-stimulated B cells; CFSE, carboxyfluorescein succinimidyl ester; INFγ, interferon gamma; PBMC, peripheral blood mononuclear cells; PolyTregs, polyclonally expanded Tregs; Tconv, conventional CD4+ T cells; Tregs, regulatory T cells; TSDR, Treg-specific demethylated region.
Figure 6
Figure 6. Suppression of skin allograft injury by PolyTregs and arTregs in vivo in a humanized mouse model
BALB/c.Rag2−/− γc−/− mice were transplanted with human skin and reconstituted with PBMC allogeneic to the skin donor. (A) PBMC reconstitution was determined at the end of the experiment, demonstrating that co-infusion of Tregs did not significantly alter the extent of PBMC reconstitution. (B) Body weight of the BALB/c.Rag2−/− γc−/− mice in four experimental groups was assessed to determine general health status, demonstrating that PBMC infusion did not induce GvHD. (C–F) Skin graft injury was assessed using three-color immunofluorescence microscopy and representative results are shown. (G) Immunofluorescence micrograph images were analyzed by counting four to six high-powered visual fields per stain for each graft. Quantitative results from four experimental groups were then compared. One-way analysis of variance with Kruskal–Wallis test and Dunn’s multiple comparison posttest was used to determine the statistical significance of the differences (*p<0.05, **p<0.01, ***p<0.001). arTregs, arTreg, alloantigen-reactive Tregs; GvHD, graft-versus-host disease; PBMC, peripheral blood mononuclear cells; PolyTregs, polyclonally expanded Tregs; Tregs, regulatory T cells.

References

    1. Sakaguchi S. Naturally arising Foxp3-expressing CD25+CD4+ regulatory T cells in immunological tolerance to self and non-self. Nat Immunol. 2005;6:345–352. - PubMed
    1. Wood KJ, Sakaguchi S. Regulatory T cells in transplantation tolerance. Nat Rev Immunol. 2003;3:199–210. - PubMed
    1. Walsh PT, Taylor DK, Turka LA. Tregs and transplantation tolerance. J Clin Invest. 2004;114:1398–1403. - PMC - PubMed
    1. Waldmann H, Adams E, Cobbold S. Reprogramming the immune system: Co-receptor blockade as a paradigm for harnessing tolerance mechanisms. Immunol Rev. 2008;223:361–370. - PubMed
    1. Tang Q, Bluestone JA, Kang SM. CD4(+)Foxp3(+) regulatory T cel therapy in transplantation. J Mol Cell Biol. 2011;4:11–21. - PMC - PubMed

Publication types