

Evolutionary interactions between haemagglutinin and neuraminidase in avian influenza
- PMID: 24103105
- PMCID: PMC3854068
- DOI: 10.1186/1471-2148-13-222
Evolutionary interactions between haemagglutinin and neuraminidase in avian influenza
Abstract
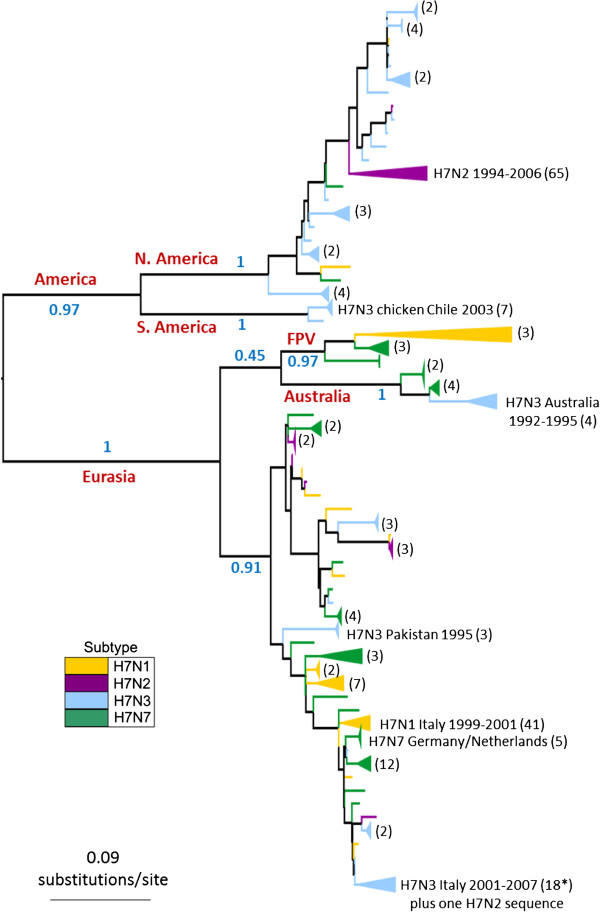
Background: Reassortment between the RNA segments encoding haemagglutinin (HA) and neuraminidase (NA), the major antigenic influenza proteins, produces viruses with novel HA and NA subtype combinations and has preceded the emergence of pandemic strains. It has been suggested that productive viral infection requires a balance in the level of functional activity of HA and NA, arising from their closely interacting roles in the viral life cycle, and that this functional balance could be mediated by genetic changes in the HA and NA. Here, we investigate how the selective pressure varies for H7 avian influenza HA on different NA subtype backgrounds.
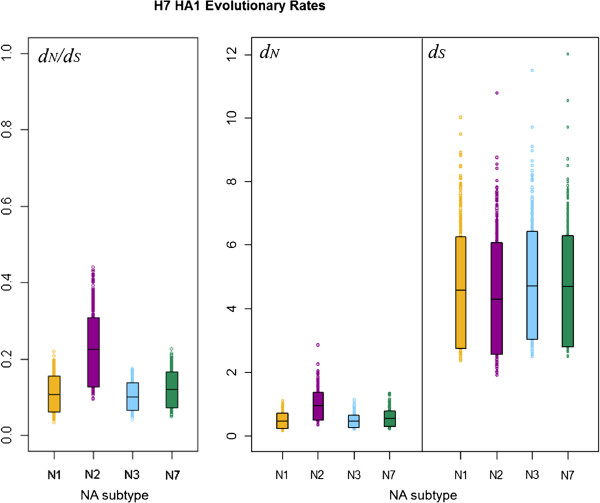
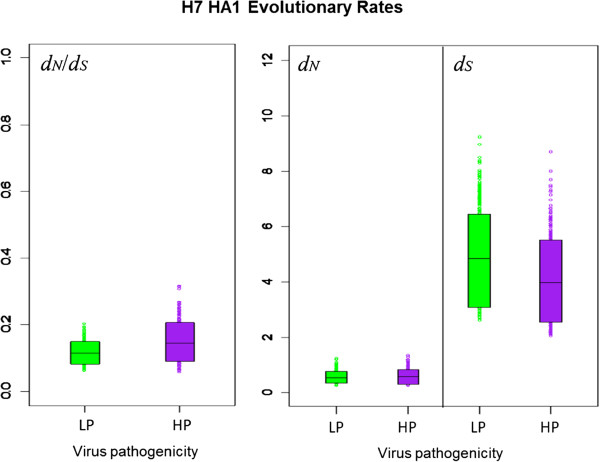
Results: By extending Bayesian stochastic mutational mapping methods to calculate the ratio of the rate of non-synonymous change to the rate of synonymous change (d(N)/d(S)), we found the average d(N)/d(S) across the avian influenza H7 HA1 region to be significantly greater on an N2 NA subtype background than on an N1, N3 or N7 background. Observed differences in evolutionary rates of H7 HA on different NA subtype backgrounds could not be attributed to underlying differences between avian host species or virus pathogenicity. Examination of d(N)/d(S) values for each subtype on a site-by-site basis indicated that the elevated d(N)/d(S) on the N2 NA background was a result of increased selection, rather than a relaxation of selective constraint.
Conclusions: Our results are consistent with the hypothesis that reassortment exposes influenza HA to significant changes in selective pressure through genetic interactions with NA. Such epistatic effects might be explicitly accounted for in future models of influenza evolution.
Figures
Similar articles
-
Hemagglutinin-Neuraminidase Balance Influences the Virulence Phenotype of a Recombinant H5N3 Influenza A Virus Possessing a Polybasic HA0 Cleavage Site.J Virol. 2015 Nov;89(21):10724-34. doi: 10.1128/JVI.01238-15. Epub 2015 Aug 5. J Virol. 2015. PMID: 26246579 Free PMC article.
-
Reassortment patterns of avian influenza virus internal segments among different subtypes.BMC Evol Biol. 2014 Jan 24;14:16. doi: 10.1186/1471-2148-14-16. BMC Evol Biol. 2014. PMID: 24456010 Free PMC article.
-
Compatibility between haemagglutinin and neuraminidase drives the recent emergence of novel clade 2.3.4.4 H5Nx avian influenza viruses in China.Transbound Emerg Dis. 2018 Dec;65(6):1757-1769. doi: 10.1111/tbed.12949. Epub 2018 Jul 12. Transbound Emerg Dis. 2018. PMID: 29999588
-
Epitopes in the HA and NA of H5 and H7 avian influenza viruses that are important for antigenic drift.FEMS Microbiol Rev. 2024 May 8;48(3):fuae014. doi: 10.1093/femsre/fuae014. FEMS Microbiol Rev. 2024. PMID: 38734891 Free PMC article. Review.
-
Functional balance between neuraminidase and haemagglutinin in influenza viruses.Clin Microbiol Infect. 2016 Dec;22(12):975-983. doi: 10.1016/j.cmi.2016.07.007. Epub 2016 Jul 15. Clin Microbiol Infect. 2016. PMID: 27424943 Review.
Cited by
-
Global dissemination of influenza A virus is driven by wild bird migration through arctic and subarctic zones.Mol Ecol. 2023 Jan;32(1):198-213. doi: 10.1111/mec.16738. Epub 2022 Oct 26. Mol Ecol. 2023. PMID: 36239465 Free PMC article.
-
Substrate specificity of avian influenza H5N1 neuraminidase.World J Virol. 2014 Nov 12;3(4):30-6. doi: 10.5501/wjv.v3.i4.30. World J Virol. 2014. PMID: 25396120 Free PMC article.
-
Computational study of interdependence between hemagglutinin and neuraminidase of pandemic 2009 H1N1.IEEE Trans Nanobioscience. 2015 Mar;14(2):157-66. doi: 10.1109/TNB.2015.2406992. Epub 2015 Mar 2. IEEE Trans Nanobioscience. 2015. PMID: 25751873 Free PMC article.
-
Coordinated Evolution of Influenza A Surface Proteins.PLoS Genet. 2015 Aug 6;11(8):e1005404. doi: 10.1371/journal.pgen.1005404. eCollection 2015 Aug. PLoS Genet. 2015. PMID: 26247472 Free PMC article.
-
Global patterns of avian influenza A (H7): virus evolution and zoonotic threats.FEMS Microbiol Rev. 2019 Nov 1;43(6):608-621. doi: 10.1093/femsre/fuz019. FEMS Microbiol Rev. 2019. PMID: 31381759 Free PMC article. Review.
References
-
- Fouchier RAM, Munster V, Wallensten A, Bestebroer TM, Herfst S, Smith D, Rimmelzwaan GF, Olsen B, Osterhaus ADME. Characterization of a novel influenza a virus hemagglutinin subtype (H16) obtained from black-headed gulls. J Virol. 2005;79:2814–2822. doi: 10.1128/JVI.79.5.2814-2822.2005. - DOI - PMC - PubMed
-
- Webster RG, Krauss S, Hulse-Post D, Sturm-Ramirez K. Evolution of influenza a viruses in wild birds. J Wildlife Dis. 2007;43:S1–S6. doi: 10.7589/0090-3558-43.1.1. - DOI
-
- Kaverin NV, Matrosovich MN, Gambaryan AS, Rudneva IA, Shilov AA, Varich NL, Makarova NV, Kropotkina EA, Sinitsin BV. Intergenic HA-NA interactions in influenza A virus: postreassortment substitutions of charged amino acid in the hemagglutinin of different subtypes. Virus Res. 2000;66:123–129. doi: 10.1016/S0168-1702(99)00131-8. - DOI - PubMed
Publication types
MeSH terms
Substances
Grants and funding
LinkOut - more resources
Full Text Sources
Other Literature Sources
Research Materials
