

Activation of peripheral nerve fibers by electrical stimulation in the sole of the foot
- PMID: 24103294
- PMCID: PMC3851563
- DOI: 10.1186/1471-2202-14-116
Activation of peripheral nerve fibers by electrical stimulation in the sole of the foot
Abstract
Background: Human nociceptive withdrawal reflexes (NWR) can be evoked by electrical stimulation applied to the sole of the foot. However, elicitation of NWRs is highly site dependent, and NWRs are especially difficult to elicit at the heel. The aim of the present study was to investigate potential peripheral mechanisms for any site dependent differences in reflex thresholds.
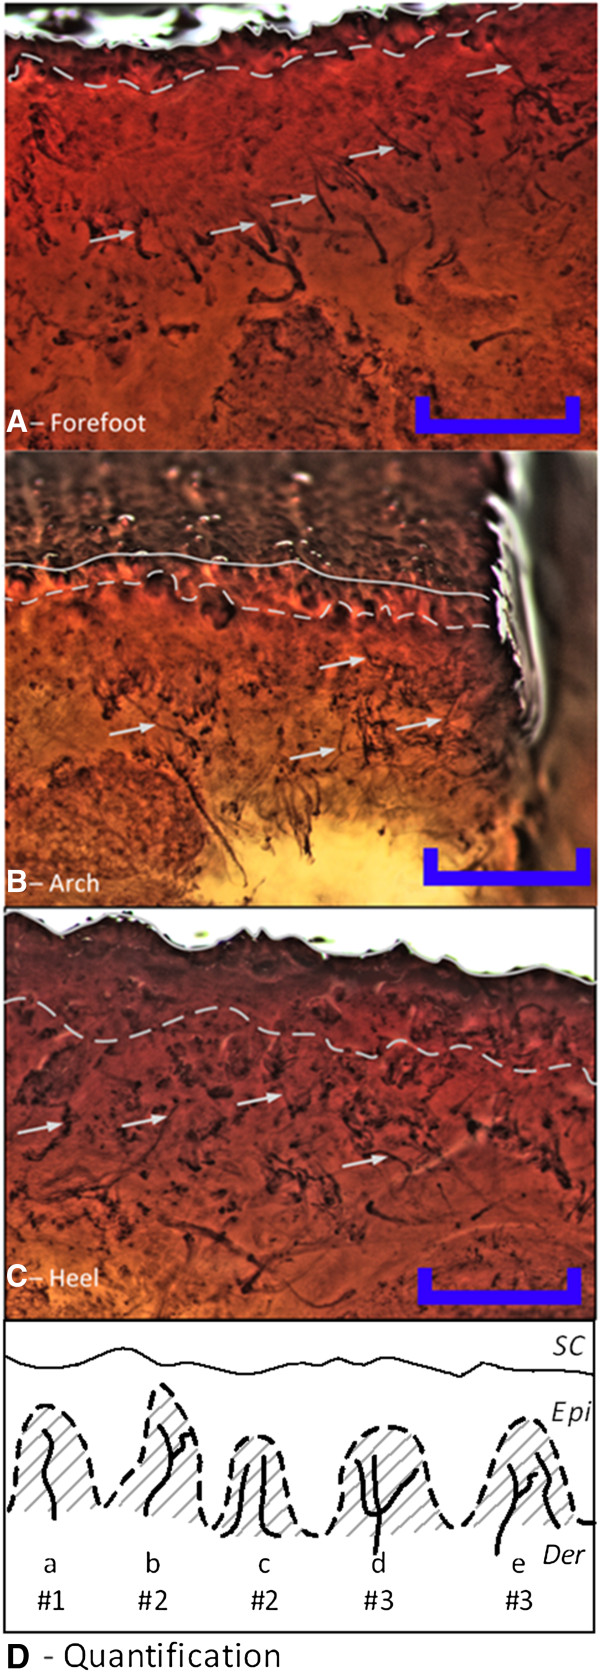
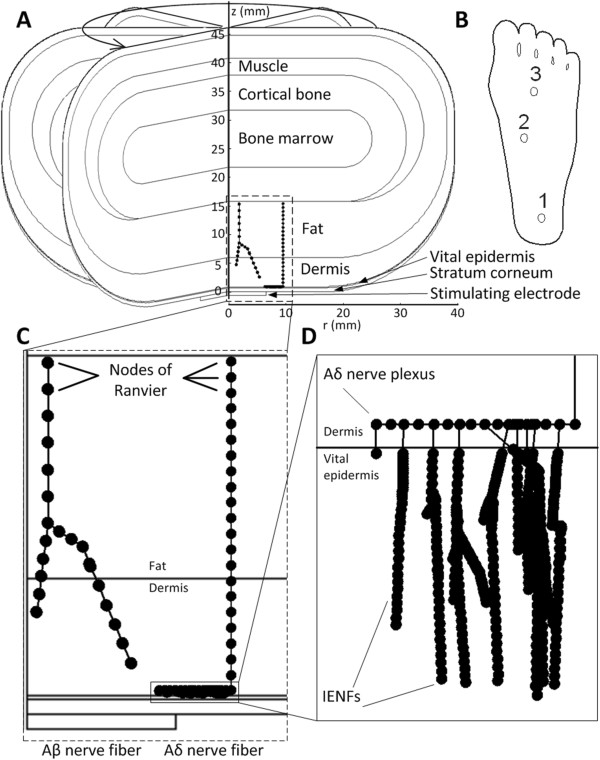
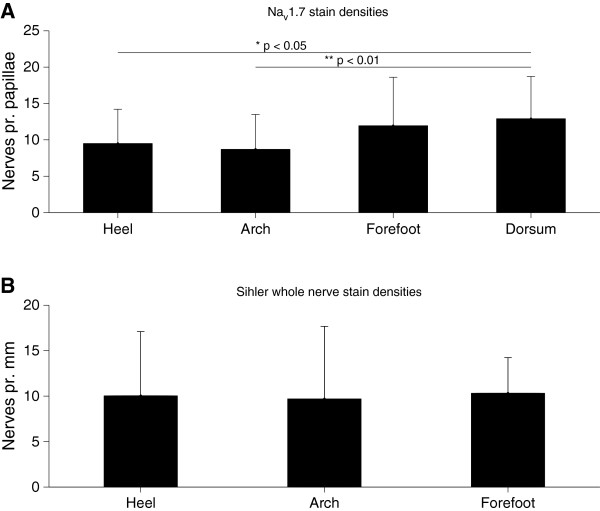
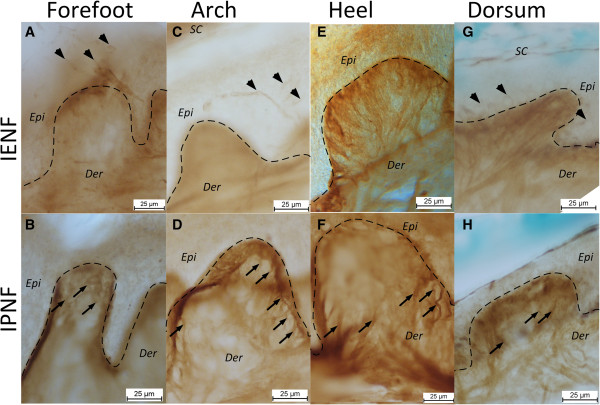
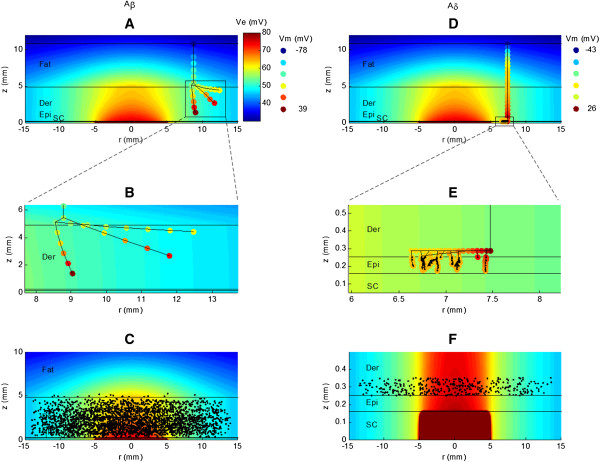
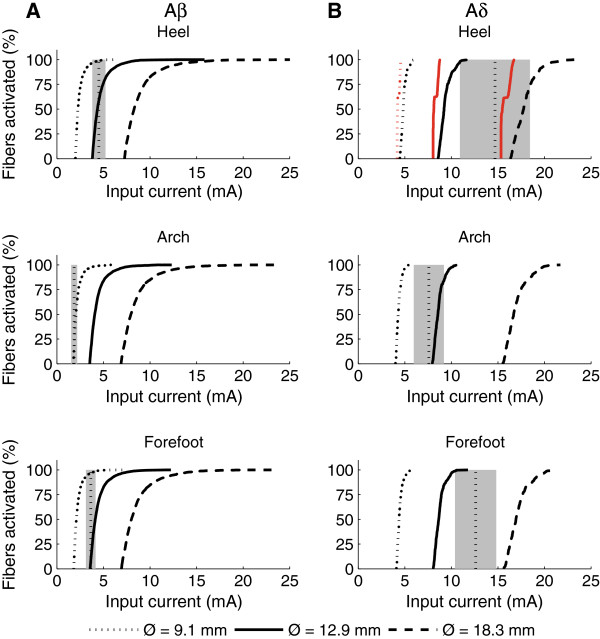
Results: The first part of the study investigated the neural innervation in different sites of the sole of the foot using two different staining techniques. 1) Staining for the Nav1.7 antigen (small nociceptive fibers) and 2) the Sihler whole nerve technique (myelinated part of the nerve). No differences in innervation densities were found across the sole of the foot using the two staining techniques: Nav1.7 immunochemistry (small nociceptive fibers (1-way ANOVA, NS)) and the Sihler's method (myelinated nerve fibers (1-way ANOVA, NS)). However, the results indicate that there are no nociceptive intraepidermal nerve fibers (IENFs) innervating the heel.Secondly, mathematical modeling was used to investigate to what degree differences in skin thicknesses affect the activation thresholds of Aδ and Aβ fibers in the sole of the foot. The modeling comprised finite element analysis of the volume conduction combined with a passive model of the activation of branching cutaneous nerve fibers. The model included three different sites in the sole of the foot (forefoot, arch and heel) and three different electrode sizes (diameters: 9.1, 12.9, and 18.3 mm). For each of the 9 combinations of site and electrode size, a total of 3000 Aβ fibers and 300 Aδ fibers was modeled. The computer simulation of the effects of skin thicknesses and innervation densities on thresholds of modeled Aδ and Aβ fibers did not reveal differences in pain and perception thresholds across the foot sole as have been observed experimentally. Instead a lack of IENFs at the heel decreased the electrical activation thresholds compared to models including IENFs.
Conclusions: The nerve staining and modeling results do not explain differences in NWR thresholds across the sole of the foot which may suggest that central mechanisms contribute to variation in NWR excitability across the sole of the foot.
Figures
Similar articles
-
Reliable estimation of nociceptive withdrawal reflex thresholds.J Neurosci Methods. 2015 Sep 30;253:110-5. doi: 10.1016/j.jneumeth.2015.06.014. Epub 2015 Jun 22. J Neurosci Methods. 2015. PMID: 26112333
-
Estimating nerve excitation thresholds to cutaneous electrical stimulation by finite element modeling combined with a stochastic branching nerve fiber model.Med Biol Eng Comput. 2011 Apr;49(4):385-95. doi: 10.1007/s11517-010-0725-8. Epub 2011 Jan 5. Med Biol Eng Comput. 2011. PMID: 21207174
-
Experimental and model-based analysis of differences in perception of cutaneous electrical stimulation across the sole of the foot.Med Biol Eng Comput. 2013 Sep;51(9):999-1009. doi: 10.1007/s11517-013-1079-9. Epub 2013 Apr 27. Med Biol Eng Comput. 2013. PMID: 23625183
-
Abeta-fiber nociceptive primary afferent neurons: a review of incidence and properties in relation to other afferent A-fiber neurons in mammals.Brain Res Brain Res Rev. 2004 Oct;46(2):131-45. doi: 10.1016/j.brainresrev.2004.07.015. Brain Res Brain Res Rev. 2004. PMID: 15464202 Review.
-
High-Resolution Multi-Scale Computational Model for Non-Invasive Cervical Vagus Nerve Stimulation.Neuromodulation. 2018 Apr;21(3):261-268. doi: 10.1111/ner.12706. Epub 2017 Oct 27. Neuromodulation. 2018. PMID: 29076212 Free PMC article. Review.
Cited by
-
Stimulating the Comfort of Textile Electrodes in Wearable Neuromuscular Electrical Stimulation.Sensors (Basel). 2015 Jul 16;15(7):17241-57. doi: 10.3390/s150717241. Sensors (Basel). 2015. PMID: 26193273 Free PMC article.
-
The primary somatosensory cortex and the insula contribute differently to the processing of transient and sustained nociceptive and non-nociceptive somatosensory inputs.Hum Brain Mapp. 2015 Nov;36(11):4346-4360. doi: 10.1002/hbm.22922. Epub 2015 Aug 7. Hum Brain Mapp. 2015. PMID: 26252509 Free PMC article.
-
Tempo-spatial integration of nociceptive stimuli assessed via the nociceptive withdrawal reflex in healthy humans.J Neurophysiol. 2021 Aug 1;126(2):373-382. doi: 10.1152/jn.00155.2021. Epub 2021 Jun 30. J Neurophysiol. 2021. PMID: 34191609 Free PMC article.
-
Electrical Characterisation of Aδ-Fibres Based on Human in vivo Electrostimulation Threshold.Front Neurosci. 2021 Jan 5;14:588056. doi: 10.3389/fnins.2020.588056. eCollection 2020. Front Neurosci. 2021. PMID: 33584171 Free PMC article.
-
Effect of site selection on pain of intravenous cannula insertion: A prospective randomised study.Indian J Anaesth. 2014 Nov-Dec;58(6):732-5. doi: 10.4103/0019-5049.147166. Indian J Anaesth. 2014. PMID: 25624538 Free PMC article.
References
Publication types
MeSH terms
LinkOut - more resources
Full Text Sources
Other Literature Sources
Medical
Miscellaneous
