

Incidence of acute respiratory infections in Australia
- PMID: 24103382
- PMCID: PMC9151186
- DOI: 10.1017/S0950268813002471
Incidence of acute respiratory infections in Australia
Abstract
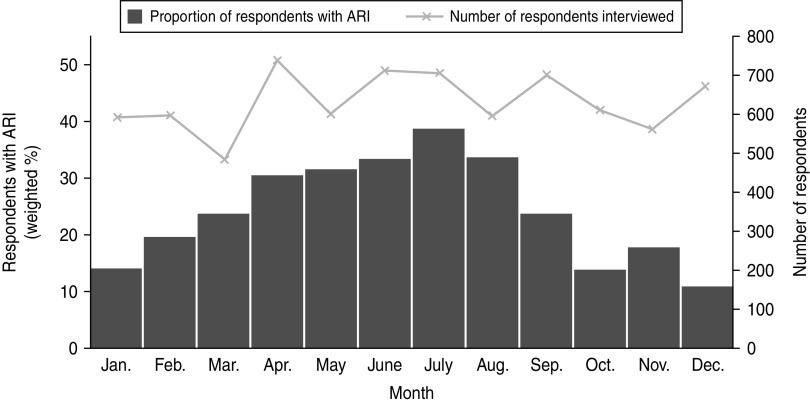
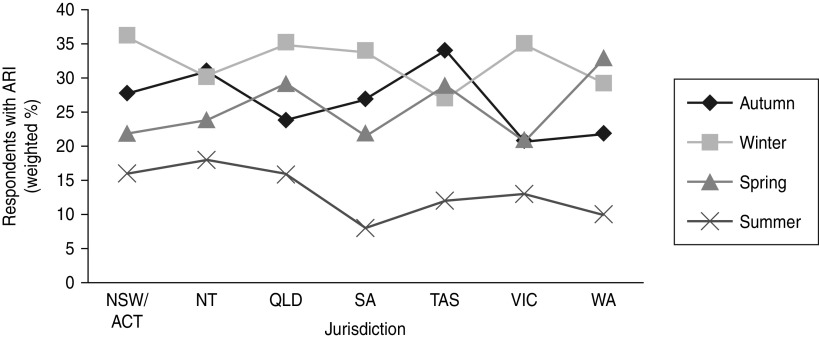
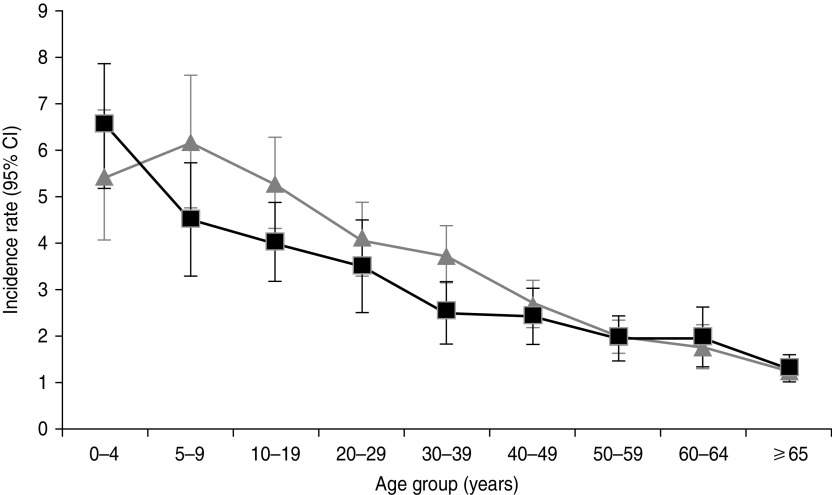
We used a national survey of 7578 randomly selected respondents in 2008-2009 to identify the period prevalence of acute respiratory infection (ARI) by season and state, and to estimate the incidence of ARI in the Australian community. A case was defined as any episode of cold or flu with at least one of the following symptoms: fever, chills, sore throat, running nose, or cough in the past 4 weeks. Frequency data were weighted to the Australian population. The response rate to the survey was 49%, and 19·9% (1505/7578) of respondents reported an ARI in the previous 4 weeks, which extrapolated to 68·9 million cases [95% confidence interval (CI) 65·1-72·7] of ARI in Australia annually. The incidence was 3·2 (95% CI 3·0-3·4) cases of ARI/person per year, and was highest in young children and lowest in older people. ARI imposes a significant burden on Australian society.
Figures
References
-
- Mathew J, Patwari A, Gupta P. Acute respiratory infection and pneumonia in India: a systematic review of literature for advocacy and action: UNICEF-PHFI Series on Newborn and Child Health, India. India Pediatrics 2011; 48: 191–218. - PubMed
-
- Berman S. Acute respiratory infections: the forgotten pandemic. Communique from the International Conference on Acute Respiratory Infections, held in Canberra, Australia, 7–10 July 1997. Clinical Infectious Diseases 1999; 28: 188. - PubMed
-
- Vega T, Lozano JE, Meerhoff T. Influenza surveillance in Europe: establishing epidemic thresholds by the moving epidemic method (http://www.ncbi.nlm.nih.gov/pubmed/22897919). Accessed 4 April 2013. - PMC - PubMed
-
- Lambert SB, et al. Respiratory illness during winter: a cohort study of urban children from temperate Australia. Journal of Paediatrics and Child Health 2005; 41: 125–129. - PubMed
Publication types
MeSH terms
LinkOut - more resources
Full Text Sources
Other Literature Sources
Miscellaneous
