Review
. 2014 Mar;31(2):197-209.
doi: 10.1017/S0952523813000382. Epub 2013 Oct 8.

Color signals through dorsal and ventral visual pathways

Affiliations
Review

Color signals through dorsal and ventral visual pathways

Bevil R Conway. Vis Neurosci. 2014 Mar.

Erratum in

  • Vis Neurosci. 2014 May;31(3):285-6

Abstract

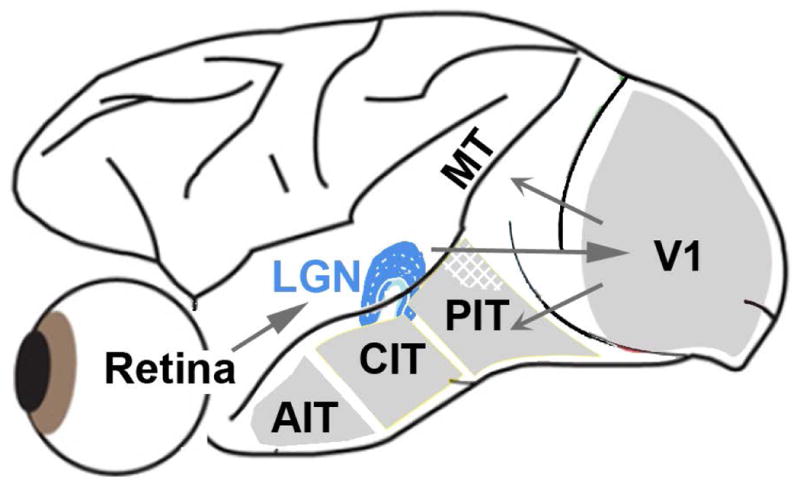
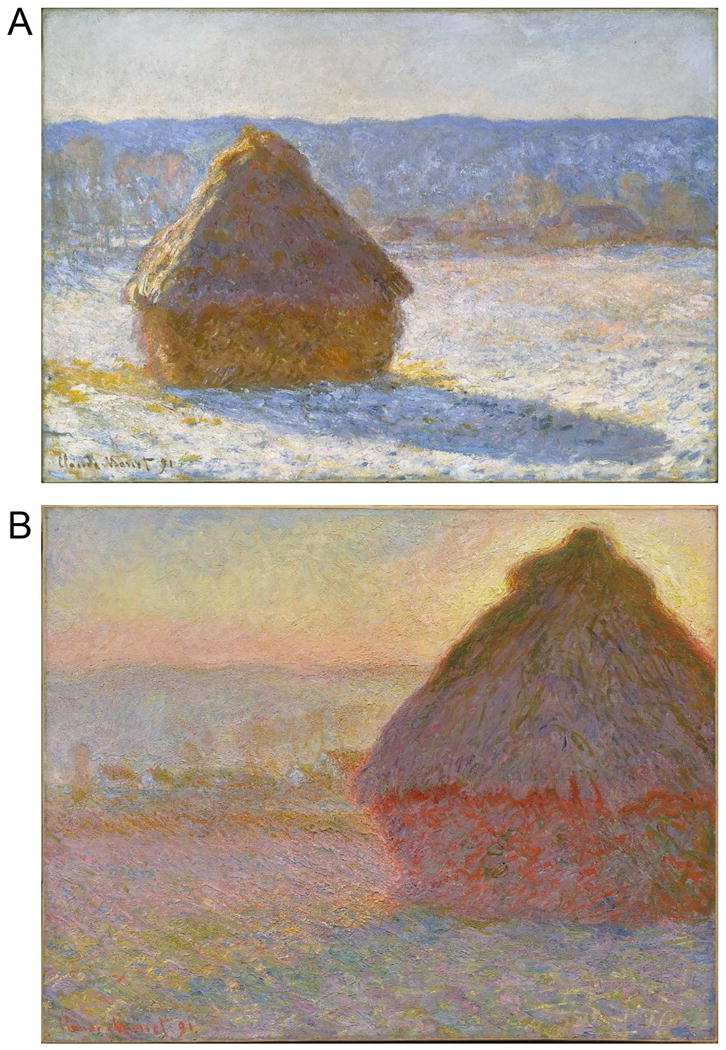
Explanations for color phenomena are often sought in the retina, lateral geniculate nucleus, and V1, yet it is becoming increasingly clear that a complete account will take us further along the visual-processing pathway. Working out which areas are involved is not trivial. Responses to S-cone activation are often assumed to indicate that an area or neuron is involved in color perception. However, work tracing S-cone signals into extrastriate cortex has challenged this assumption: S-cone responses have been found in brain regions, such as the middle temporal (MT) motion area, not thought to play a major role in color perception. Here, we review the processing of S-cone signals across cortex and present original data on S-cone responses measured with fMRI in alert macaque, focusing on one area in which S-cone signals seem likely to contribute to color (V4/posterior inferior temporal cortex) and on one area in which S signals are unlikely to play a role in color (MT). We advance a hypothesis that the S-cone signals in color-computing areas are required to achieve a balanced neural representation of perceptual color space, whereas those in noncolor-areas provide a cue to illumination (not luminance) and confer sensitivity to the chromatic contrast generated by natural daylight (shadows, illuminated by ambient sky, surrounded by direct sunlight). This sensitivity would facilitate the extraction of shape-from-shadow signals to benefit global scene analysis and motion perception.


Figures

Figure 1
Figure 1
Simple schematic of the brain showing the visual pathway from the retina, through the dorsal lateral geniculate nucleus of the thalamus (LGN), up to primary visual cortex (V1). From V1, through intermediate visual areas (V2, V3, V4, not labeled), two major routes have been described, a dorsal pathway through MT (and related areas), and a ventral pathway through posterior, central and anterior inferior temporal (IT) cortex. The dorsal pathway has been implicated in encoding dynamic spatiotemporal relationships among visual objects (object action), while the ventral pathway is thought to represent stable attributes of objects (object quality)(DiCarlo et al., 2012; Kravitz et al., 2012). S-cone activation drives responses within both dorsal and ventral pathways. IT contains regions that are relatively more responsive to color (one such region is shown hatched in PIT).
Figure 2
Figure 2
Spatial organization of cone inputs to a double-opponent cell recorded in alert macaque primary visual cortex. A, Spatial receptive-field map generated using sparse noise cone-isolating stimuli and reverse correlation. Scale of the small divisions on the grid is 0.75° of visual angle. The receptive-field center of the cell was activated by the “+” direction of the L-cone stimulus and the “-“ direction of the M-cone stimulus, both of which appear reddish, but also by the “-“ direction of the S stimulus, which appears lime. Note that the colors associated with the optimal polarity for each of the three cone-isolating stimuli do not fall in the same category, undermining the claim that the neuron contributes directly to hue. The inset gives an indication of the color of each stimulus (although the actual stimuli were presented on a computer monitor and carefully color calibrated). A “+” stimulus causes a selective increase in activation of the given cone type (compared to the activation generated by the adapting background); a “-“ stimulus causes a selective decrease in cone activation. B, Spike-triggered average traces. The receptive-field center (central region in panels, A) was excited by an increase in L-cone activity (L+) or a decrease in M or S activity (M–, S–), and suppressed by a decrease in L (L–) or an increase in M or S (M+, S+); the receptive-field surround gave the opposite pattern of responses. Data from (Conway, 2001; Conway & Livingstone, 2006).
Figure 3
Figure 3
Responses measured with fMRI in human subjects to stimuli with luminance contrast (squares) or S-cone contrast (diamonds). A, V1 responses. B, MT responses. The shape of the S-cone response function in V1 is not a scaled version of the luminance response, consistent with the conclusion that the response to the two stimuli are mediated by different underlying neural components (i.e. the S-cone responses is not just driving the luminance channel weakly). Luminance responses in MT are ∼6X greater than luminance responses in V1; S-cone responses in MT are ∼2X greater than those in V1. From (Wandell et al., 1999).
Figure 4
Figure 4
Neurons in macaque LGN identified after retrograde tracer injection in area MT and V1. A, Low-power of a slice through the entire LGN showing MT-projecting cells in red and V1-projecting cells in black. B, High-power of the boxed region in A. MT-projecting cells labeled in blue; V1-projecting cells labeled in brown. Note the two MT-projecting neurons that are conspicuously not double-labeled, showing that the axons of these neurons project directly to MT and bypass V1. MT-projecting neurons appear to be located preferentially within the koniocellular layers of the LGN, which are thought to carry strong S-cone signals. Data from (Sincich et al., 2004).
Figure 5
Figure 5
Cone-opponent cells in V1 are biased in chromatic tuning for colors of the daylight axis. A, responses of a population of cone-opponent neurons to cone-isolating stimuli, projected on the cone-opponent axes. Inset top right shows the standard C.I.E. chromaticity diagram with the cone-opponent axes intersecting at the neutral point, and the chromaticities of many samples of daylight. Inset top right shows the equiluminant plane through the DKL color space. Note that the 45° axis extending from –S/L-M through the origin towards +S/M-L forms the “daylight” axis. B, Macaque V1 responses measured using fMRI to different color directions of the DKL color space. Note the bias for the daylight axis. Responses have been normalized to 1. Stimuli comprised heterochromatic gratings, 2.9 cycles/degree, drifting slowly at 0.75 cycles/second, reversing direction every 2 seconds. Data from experiment 1 in (Lafer-Sousa et al., 2012).
Figure 6
Figure 6
Responses measured using fMRI to different color directions of the DKL color space at multiple stages of visual processing. A, Responses within the LGN. B, Responses in MT. C, Responses in the portions of posterior IT that do not show a color bias (“i” for “in between” color-biased regions). D, Responses within color-biased regions of PIT. Responses in V1 shown in gray for comparison. Other conventions as for Figure 5B. PITi shows a pronounced bias along the daylight axis. Data from experiment 1 in (Lafer-Sousa et al., 2012). Cone contrasts for the four chromatic conditions given in Table 1 (adapted from Table 2 of Lafer-Sousa et al., 2012). Note that the two intermediate axes would elicit the same average activation of the underlying cardinal mechanisms, and that the total cone contrast (sum of L, M and S-cone contrasts) was much higher for the S stimulus than for the L-M stimulus. Despite the higher cone contrast, the response to the S stimulus was relatively low in LGN, V1, MT and PITi compared to the response to the L-M stimulus. PITc showed a relatively stronger response to S cones compared to V1. The increase in response along the S-axis within PIT color-biased regions achieves a more balanced response to all colors around the color wheel, and is consistent with the more likely involvement of this region in encoding color perception.
Figure 7
Figure 7
A, Morning Snow Effect (1891), oil on canvas (65.4×92.4cm), by Claude Monet. Museum of Fine Arts, Boston. B, Haystacks (Sunset)(1891), oil on canvas (73.3×92.7 cm), by Claude Monet. Museum of Fine Arts, Boston. Monet routinely depicts shadows with blue, surrounded by daylight yellow-orange.
Figure 8
Figure 8
Cone inputs to a green-tuned glob cell in PIT. A, Orientation tuning (max. 2 spikes/sec.) B, Color tuning (thick, medium and thin lines show tuning to higher, equal-with-background and lower luminance stimuli). C, L, M and S cone inputs. Compare with V1 cell (Fig. 2). Unpublished data of the author; see (Conway et al., 2007).
Figure 9
Figure 9
Color-tuned neurons in PIT globs are clustered by color selectivity, and arranged according to “chromatopic” hue maps. A, Anatomical MRI of electrode targeting a color-biased region (glob). Scale, 1cm. B, Color tuning of six sequentially encountered neurons. Polar coordinates as for Figure 8B. C, Color tuning of all neurons encountered along the electrode path. Gray symbols show “outliers”. D, Latency of the responses of the neurons. Data from (Conway & Tsao, 2009).
Figure 10
Figure 10
Responses of a blue-tuned cell in PIT assessed using stimuli defined by the cone-opponent axes with which the retina/LGN represent color. A, Cone-opponent “DKL” color space, showing colors in the equiluminant plane at the adaptation point. B, Color stimuli of various saturations and luminance contrasts defined by the cone-opponent color space and projected in the standard C.I.E. xyY chromaticity space. C, Response of one color-tuned neuron to stimuli of varying saturation. Latencies (symbols) are systematically longer with lower saturation stimuli (responses at each saturation averaged across colors; colors defined within the equiluminant plane defined by the adapting background). Inset shows color tuning measured at three saturation levels. Figure prepared by Monica Gates and Galina Gagin (Unpublished data of the author).
Figure 11
Figure 11
Munsell color system of perceptual color space. A, From Munsell (1907): “The color tree is made by taking the vertical axis of the [color] sphere, which carries a scale of value [brightness or luminance], for the trunk. The branches are at right angles to the trunk; and, as in the sphere, they carry the scale of chroma [saturation]. Colored balls on the branches tell their Hue. In order to show the MAXIMA of color, each branch is attached to the trunk (or neutral axis) at a level demanded by its value,—the yellow nearest white at the top, then the green, red, blue, and purple branches, approaching black in the order of their lower values. The color tree prolongs [the chroma axes to represent] the most powerful red, yellow, green, blue, and purple pigments which we now possess, and could be lengthened, should stronger chromas be discovered.” B, A horizontal plane through the Munsell system showing the non-spherical nature of the color plane. C, A color plate from Munsell's original book, showing The color sphere (top), fifteen typical steps taken from the sphere (middle), and the value and chroma scale (bottom). As Munsell noted, “Pigment inequalities here become very apparent.”

Similar articles

Cited by

References

    1. Barberini CL, Cohen MR, Wandell BA, Newsome WT. Cone signal interactions in direction-selective neurons in the middle temporal visual area (MT) J Vis. 2005;5:603–621. - PubMed
    1. Baylor DA, Nunn BJ, Schnapf JL. Spectral sensitivity of cones of the monkey Macaca fascicularis. Journal of Physiology. 1987;390:145–160. - PMC - PubMed
    1. Brainard DH, Stockman A. Colorimetry. In: Bass M, editor. OSA Handbook of Optics. 3rd. McGraw-Hill; New York: 2010. pp. 10.11–11.56.
    1. Brouwer GJ, Heeger DJ. Decoding and reconstructing color from responses in human visual cortex. J Neurosci. 2009;29:13992–14003. - PMC - PubMed
    1. Calkins DJ, Tsukamoto Y, Sterling P. Microcircuitry and mosaic of a blue-yellow ganglion cell in the primate retina. Journal of Neuroscience. 1998;18:3373–3385. - PMC - PubMed

Publication types

LinkOut - more resources