

Inhibition of Mcl-1 expression by citrate enhances the effect of Bcl-xL inhibitors on human ovarian carcinoma cells
- PMID: 24103422
- PMCID: PMC3851866
- DOI: 10.1186/1757-2215-6-72
Inhibition of Mcl-1 expression by citrate enhances the effect of Bcl-xL inhibitors on human ovarian carcinoma cells
Abstract
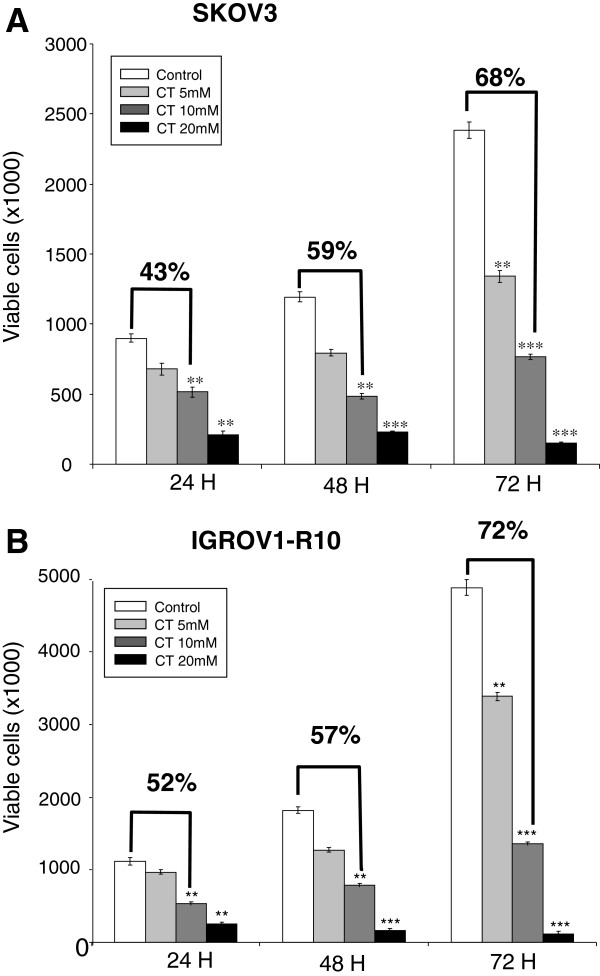
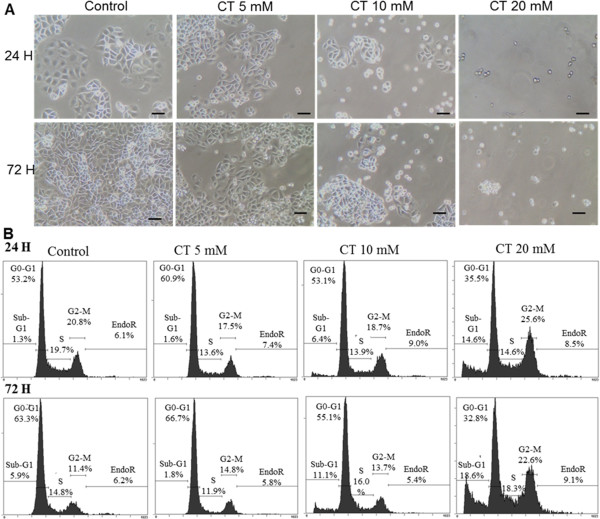
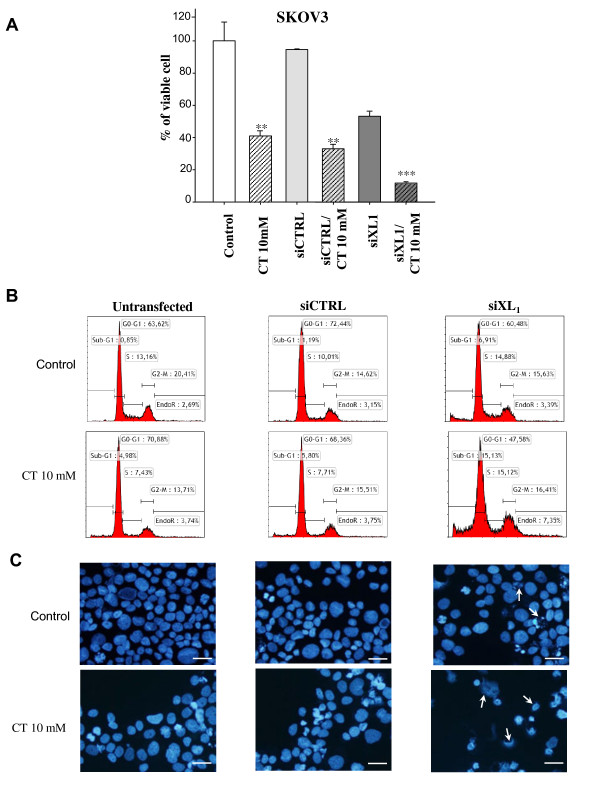
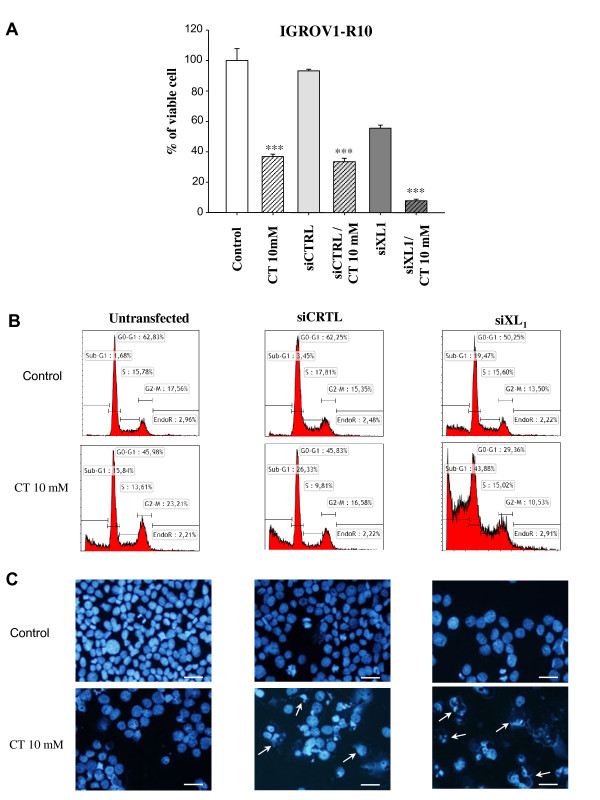
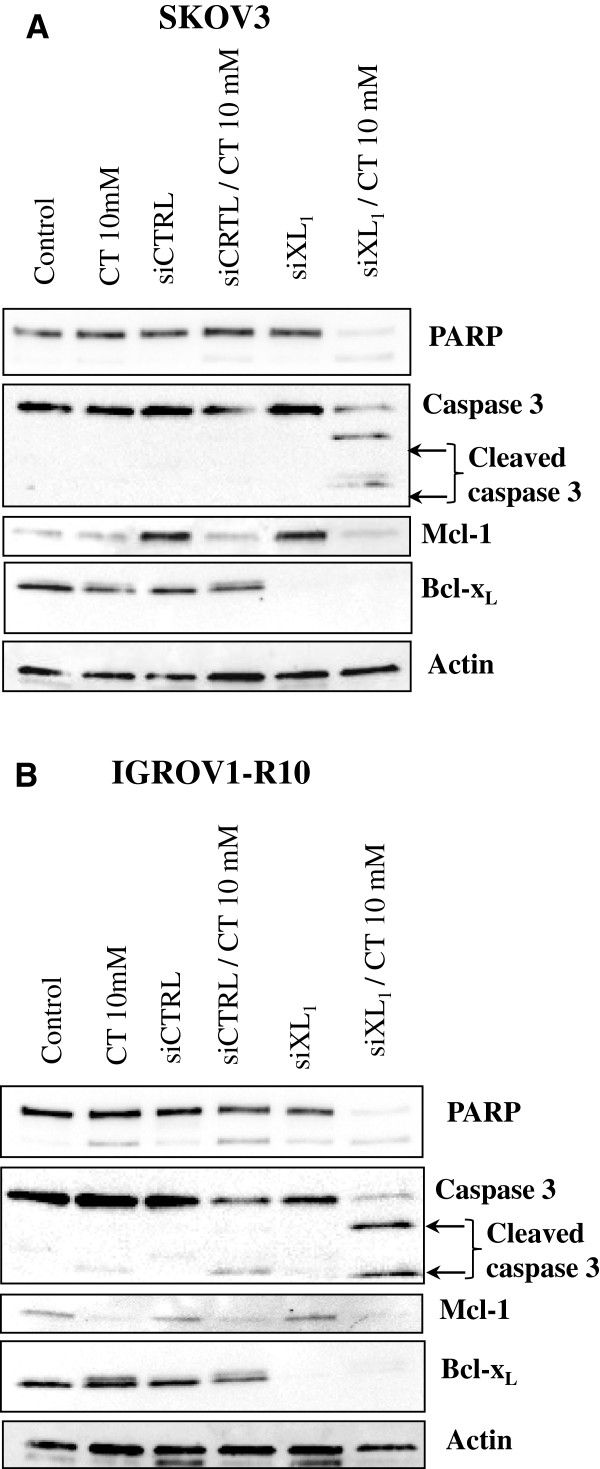
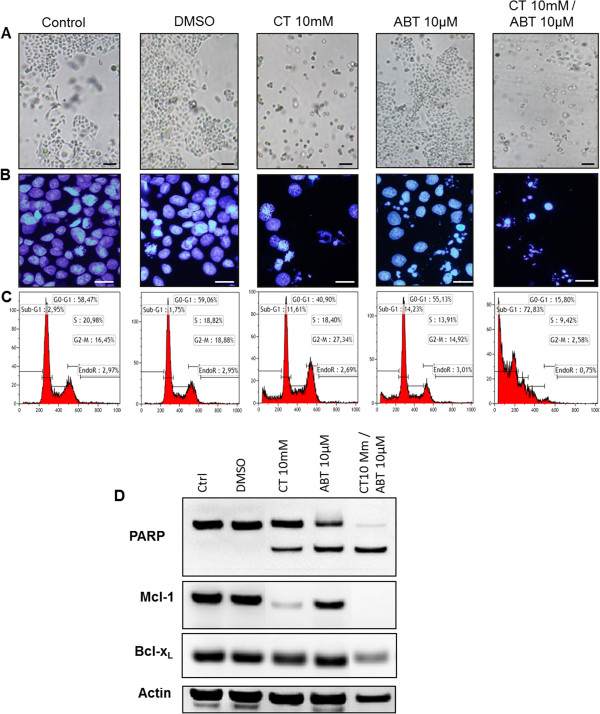
The inhibition of two major anti-apoptotic proteins, Bcl-xL and Mcl-1, appears essential to destroy chemoresistant cancer cells. We have studied their concomitant inhibition, using ABT 737 or siRNA targeting XL1 and citrate, a molecule which reduces the expression level of Mcl-1.Two cisplatin-chemoresistant ovarian cell lines (SKOV3 and IGROV1-R10) were exposed to ABT 737 or siRNA targeting XL1 and citrate at various individual concentrations, or combined. Cell proliferation, cell cycle repartition and nuclear staining with DAPI were recorded. Western blot analyses were performed to detect various proteins implied in apoptotic cell death pathways.Mcl-1 expression was barely reduced when cells were exposed to citrate alone, whereas a mild reduction was observed after ABT 737 treatment. Concomitant inhibition of Bcl-xL and Mcl-1 using ABT 737 or siXL1 associated with citrate was far more effective in inhibiting cell proliferation and inducing cell death than treatment alone.Given that few, if any, specific inhibitors of Mcl-1 are currently available, anti-glycolytic agents such as citrate could be tested in association with synthetic inhibitors of Bcl-xL.
Figures
Similar articles
-
Sensitization of ovarian carcinoma cells to Bcl-xL-targeting strategies through indirect modulation of Mcl-1 activity by MR22388, a molecule of the tripentone family.J Ovarian Res. 2013 Jun 5;6(1):38. doi: 10.1186/1757-2215-6-38. J Ovarian Res. 2013. PMID: 23735052 Free PMC article.
-
The anticancer effect of the HDAC inhibitor belinostat is enhanced by inhibitors of Bcl-xL or Mcl-1 in ovarian cancer.Mol Oncol. 2025 Jun 8. doi: 10.1002/1878-0261.70050. Online ahead of print. Mol Oncol. 2025. PMID: 40483575
-
Platinum compounds sensitize ovarian carcinoma cells to ABT-737 by modulation of the Mcl-1/Noxa axis.Apoptosis. 2013 Apr;18(4):492-508. doi: 10.1007/s10495-012-0799-x. Apoptosis. 2013. PMID: 23344663
-
The mTORC1/2 Inhibitor AZD8055 Strengthens the Efficiency of the MEK Inhibitor Trametinib to Reduce the Mcl-1/[Bim and Puma] ratio and to Sensitize Ovarian Carcinoma Cells to ABT-737.Mol Cancer Ther. 2017 Jan;16(1):102-115. doi: 10.1158/1535-7163.MCT-16-0342. Epub 2016 Dec 15. Mol Cancer Ther. 2017. PMID: 27980105
-
Lipoic acid decreases Mcl-1, Bcl-xL and up regulates Bim on ovarian carcinoma cells leading to cell death.J Ovarian Res. 2015 Jun 12;8:36. doi: 10.1186/s13048-015-0165-z. J Ovarian Res. 2015. PMID: 26063499 Free PMC article.
Cited by
-
The Tricarboxylic Acid Cycle Metabolites for Cancer: Friend or Enemy.Research (Wash D C). 2024 Jun 12;7:0351. doi: 10.34133/research.0351. eCollection 2024. Research (Wash D C). 2024. PMID: 38867720 Free PMC article. Review.
-
Citrate Promotes Excessive Lipid Biosynthesis and Senescence in Tumor Cells for Tumor Therapy.Adv Sci (Weinh). 2022 Jan;9(1):e2101553. doi: 10.1002/advs.202101553. Epub 2021 Nov 7. Adv Sci (Weinh). 2022. PMID: 34747157 Free PMC article.
-
CircRNA-regulated glucose metabolism in ovarian cancer: an emerging landscape for therapeutic intervention.Clin Transl Oncol. 2024 Mar;26(3):584-596. doi: 10.1007/s12094-023-03285-4. Epub 2023 Aug 14. Clin Transl Oncol. 2024. PMID: 37578652 Review.
-
Effects of siRNA-mediated silencing of myeloid cell leukelia-1 on the biological behaviors and drug resistance of gastric cancer cells.Am J Transl Res. 2015 Nov 15;7(11):2397-411. eCollection 2015. Am J Transl Res. 2015. PMID: 26807186 Free PMC article.
-
Extracellular Citrate Is a Trojan Horse for Cancer Cells.Front Mol Biosci. 2020 Nov 12;7:593866. doi: 10.3389/fmolb.2020.593866. eCollection 2020. Front Mol Biosci. 2020. PMID: 33282912 Free PMC article.
References
LinkOut - more resources
Full Text Sources
Other Literature Sources
Research Materials
