. 2013 Oct 8;12(1):118.
doi: 10.1186/1476-4598-12-118.

Reversal of chemosensitivity and induction of cell malignancy of a non-malignant prostate cancer cell line upon extracellular vesicle exposure

Affiliations

Reversal of chemosensitivity and induction of cell malignancy of a non-malignant prostate cancer cell line upon extracellular vesicle exposure

Kiriaki Panagopoulos et al. Mol Cancer. .

Abstract

Background: Extracellular vesicle (EV) trafficking is a fundamental cellular process that occurs in cells and is required for different aspects of pathophysiology. EV trafficking leads to changes in cellular function including apoptosis, angiogenesis and proliferation required for increased tumor formation.

Results: We report several phenotypic changes mediated by EVs isolated from non-malignant and malignant prostate cells as well as patient biopsied prostate tumor samples. EVs can reverse the resistance of prostate cancer cells to camptothecin EVs isolated from non-malignant PrECs (Prostate Epithelial Cells) can reverse soft agar colony formation of malignant DU145 cells, with the reciprocal effect observed. Isolation of EVs from 2 Gleason grade 8 prostate cancer patients significantly induced soft agar colony formation of non-malignant PrECs. We have identified proteins via antibody and Mass spectrometry analysis that may be responsible for the phenotypic changes. Mass spectrometry analysis of protein lysates using ProteoIQ revealed protein candidates associated with gene ontology annotations that may be responsible for this phenotypic change. Ingenuity Pathway Analysis was used to identify statistically relevant canonical pathways and functions associated the protein IDs and expression values obtained using ProteoIQ. Western blot analysis confirmed the increase of 14-3-3 zeta, pRKIP and prohibitin protein levels in PrEC cells co-cultured with patient EVs. 14-3-3 proteins were also found as common proteins of 3 other Gleason grade 8 patients.

Conclusion: Our study provides a rational basis to further investigate putative proteins, such as 14-3-3 and prohibitin and genetic factors that may be responsible for phenotypic changes that are associated with prostate cancer progression.


Figures

Figure 1
Figure 1
Extracellular vesicle-mediated reversal of apoptosis resistance and sensitivity. A, B. EVs were isolated from DU145 and RC1 cells. The EVs were resuspended in PBS. DU145 cells were co-cultured with RC1 EVs (REV) and RC1 cells were co-cultured with DU145 EVs (DEV). Non-EV and EV co-cultured cells were treated with 100 nM CPT for 24 h and examined for PARP cleavage and actin via Western blot analysis. Proteins (unless indicated 50 μg/sample was used for Western blot analysis) were separated by 10% SDS-PAGE, transferred to nitrocellulose and analyzed with antibodies to the indicated proteins. C,D. The same experiment from B,C was repeated and the samples were examined for apoptosis via propidium iodide staining using a flow cytometer. The data is the mean +/− s.d. of 2 independent experiments performed in triplicate. Note: for all Western blots described in this Figure legend and for all other subsequent Figure legends, the exposure time used to identify the various proteins was variable.
Figure 2
Figure 2
Extracellular vesicle-mediated reversal of soft agar growth. A, EVs were isolated from normal prostate (PrEC) and malignant (DU145) cells. PrECs were co-cultured with DU145 EVs and DU145 cells were co-cultured with PrEC EVs for 7 days. B, The same experiment from A was repeated with EVs and conditioned medium (CM) isolated from DU145 cells and co-cultured with PrEC cells for 7 days. 50 mls of CM was concentrated and used for the experiment. In both experiments, cells were harvested and utilized for soft agar cloning. Soft agar cloning was examined using 0.7% agarose in PBS and mixed with 1× media with 10% FBS. The top layer consisted of 0.35% agarose in PBS, 1× media with 10% FBS, and 1 x 10⁵ cells per dish. Dishes were incubated at 37°C and 5% CO2. After two weeks, cell colonies were counted. 5 fields/dish using the 40× objective were counted and there were 5 dishes/condition. A paired t-test was performed to analyze the increase in soft agar colony formation of in A: PrEC + DU145 EVs when compared to untreated PrEC cells, * p < 0.002, and the decrease in soft agar colony formation of DU 145 + PrEC EVs when compared to untreated DU145 cells **p < 0.0004. In B: PrEC + p < 0.0003 when compared to untreated PrEC cells. *p < 0.0005.
Figure 3
Figure 3
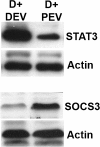
Extracellular vesicle-mediated changes in cellular protein expression. EVs were isolated from DU145 and PrECs and resuspended in PBS. EVs were co-cultured with DU145 cells and whole cell lysates were prepared for Western blot analysis as reported. Western blot analysis results show that DU145 cells co-cultured with self-EVs have enhanced expression of STAT3, while co-culture with PrEC EVs leads to increased expression of SOCS3.
Figure 4
Figure 4
Enhancement of soft agar growth via prostate patient-derived EVs. EVs were isolated from 2 prostate cancer patients with Gleasons grade 8. The EVs were co-cultured with PrECs for 7 days after which soft agar growth was determined. 6 fields/dish were counted and the data represents the mean +/− s.d. of 2 independent experiments performed in triplicate. A paired t-test was performed to analyze the increase in soft agar colony formation of PrEC cells when co-cultured with EVs from patient 18, * p < 0.0005, and patient 19 **p < 0.0001 when compared to untreated PrEC cells. Note the increase in colony size in PrECs (bottom panel) co-cultured patient tumor EVs. The pictures are representative of an area of a field that was counted.
Figure 5
Figure 5
Detection of proteins from patients EVs. A. EVs were isolated from conditioned medium from tissue biopsied from 2 patients as described in Experimental procedures. EVs were co-cultured with PrECs for 7 days. A portion of the sample was used for mass spec analysis while the other for Western blot analysis. We examined the expression of pRKIP, RKIP, 14-3-3 zeta and actin based on the Uniprot ID data (Table 2). B. Venn diagram comparing the protein content of PrECs alone vs. PrECs co-cultured with Patient 18 EVs (8 proteins were unique to PrECs alone, 16 proteins were unique to PrECs co-cultured with Patient 18 EVs, and 28 proteins were found in common). C. Venn diagram comparing the protein content of PrECs alone vs. PrECs co-cultured with Patient 19 EVs (8 proteins were unique to PrECs alone, 15 proteins were unique to PrECs co-cultured with Patient 19 EVs, and 28 proteins were found in common). D. Venn diagram comparing the protein content of PrECs co-cultured with Patient 18 EVs vs. PrECs co-cultured with Patient 19 EVs (44 proteins were unique to PrECs co-cultured with Patient 18 EVs, 43 proteins were unique to PrECs co-cultured with Patient 19 EVs, and 38 proteins were found in common).
Figure 6
Figure 6
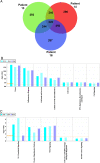
Common proteins between patients 13, 14, and 16 and associated functions and canonical pathways. The Venn diagram shows the common and unique proteins between patients 13, 14, and 16, A The bar graphs show the significance (−log(p-value)) of specific functions, B, and canonical pathways, C, in each patient. The threshold cutoff of significance is p < 0.05 (or –log = 1.3).
Figure 7
Figure 7
Common proteins between patients 13, 14, 16, 18, and 19 and associated functions and canonical pathways. IPA analysis of the 71 common proteins between patients 13, 14, 16, 18, and 19. The bar graphs show the significance (−log(p-value)) of specific functions, A, and canonical pathways, B, in each patient. The threshold cutoff of significance is p < 0.05 (or –log = 1.3).

References

    1. Han M, Partin AW, Zahurak M, Piantadosi S, Epstein JI, Walsh PC. Biochemical (prostate specific antigen) recurrence probability following radical prostatectomy for clinically localized prostate cancer. J Urol. 2003;169:517–523. doi: 10.1016/S0022-5347(05)63946-8. - DOI - PubMed
    1. Bolla M, Collette L, Blank L, Warde P, Dubois JB, Mirimanoff RO, Storme G, Bernier J, Kuten A, Sternberg C. et al.Long-term results with immediate androgen suppression and external irradiation in patients with locally advanced prostate cancer (an EORTC study): a phase III randomised trial. Lancet. 2002;360:103–106. doi: 10.1016/S0140-6736(02)09408-4. - DOI - PubMed
    1. Hanks GE, Pajak TF, Porter A, Grignon D, Brereton H, Venkatesan V, Horwitz EM, Lawton C, Rosenthal SA, Sandler HM. et al.Phase III trial of long-term adjuvant androgen deprivation after neoadjuvant hormonal cytoreduction and radiotherapy in locally advanced carcinoma of the prostate: the radiation therapy oncology group protocol 92–02. J Clin Oncol. 2003;21:3972–3978. doi: 10.1200/JCO.2003.11.023. - DOI - PubMed
    1. Pilepich MV, Winter K, Lawton CA, Krisch RE, Wolkov HB, Movsas B, Hug EB, Asbell SO, Grignon D. Androgen suppression adjuvant to definitive radiotherapy in prostate carcinoma–long-term results of phase III RTOG 85–31. Int J Radiat Oncol Biol Phys. 2005;61:1285–1290. doi: 10.1016/j.ijrobp.2004.08.047. - DOI - PubMed
    1. Pilepich MV, Winter K, John MJ, Mesic JB, Sause W, Rubin P, Lawton C, Machtay M, Grignon D. Phase III radiation therapy oncology group (RTOG) trial 86–10 of androgen deprivation adjuvant to definitive radiotherapy in locally advanced carcinoma of the prostate. Int J Radiat Oncol Biol Phys. 2001;50:1243–1252. doi: 10.1016/S0360-3016(01)01579-6. - DOI - PubMed

Publication types

MeSH terms