Ozone induces glucose intolerance and systemic metabolic effects in young and aged Brown Norway rats
- PMID: 24103449
- PMCID: PMC4343260
- DOI: 10.1016/j.taap.2013.09.029
Ozone induces glucose intolerance and systemic metabolic effects in young and aged Brown Norway rats
Abstract
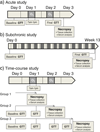
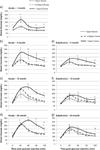
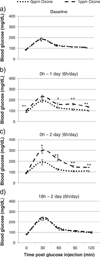
Air pollutants have been associated with increased diabetes in humans. We hypothesized that ozone would impair glucose homeostasis by altering insulin signaling and/or endoplasmic reticular (ER) stress in young and aged rats. One, 4, 12, and 24 month old Brown Norway (BN) rats were exposed to air or ozone, 0.25 or 1.0 ppm, 6 h/day for 2 days (acute) or 2 d/week for 13 weeks (subchronic). Additionally, 4 month old rats were exposed to air or 1.0 ppm ozone, 6 h/day for 1 or 2 days (time-course). Glucose tolerance tests (GTT) were performed immediately after exposure. Serum and tissue biomarkers were analyzed 18 h after final ozone for acute and subchronic studies, and immediately after each day of exposure in the time-course study. Age-related glucose intolerance and increases in metabolic biomarkers were apparent at baseline. Acute ozone caused hyperglycemia and glucose intolerance in rats of all ages. Ozone-induced glucose intolerance was reduced in rats exposed for 13 weeks. Acute, but not subchronic ozone increased α2-macroglobulin, adiponectin and osteopontin. Time-course analysis indicated glucose intolerance at days 1 and 2 (2>1), and a recovery 18 h post ozone. Leptin increased day 1 and epinephrine at all times after ozone. Ozone tended to decrease phosphorylated insulin receptor substrate-1 in liver and adipose tissues. ER stress appeared to be the consequence of ozone induced acute metabolic impairment since transcriptional markers of ER stress increased only after 2 days of ozone. In conclusion, acute ozone exposure induces marked systemic metabolic impairments in BN rats of all ages, likely through sympathetic stimulation.
Keywords: Aging; Air pollution; Epinephrine; Metabolic syndrome; Ozone; Serum biomarkers.
© 2013.
Conflict of interest statement
The authors declare that there are no conflicts of interest.
Figures


Similar articles
-
Systemic metabolic derangement, pulmonary effects, and insulin insufficiency following subchronic ozone exposure in rats.Toxicol Appl Pharmacol. 2016 Sep 1;306:47-57. doi: 10.1016/j.taap.2016.06.027. Epub 2016 Jun 28. Toxicol Appl Pharmacol. 2016. PMID: 27368153 Free PMC article.
-
Inhaled ozone (O3)-induces changes in serum metabolomic and liver transcriptomic profiles in rats.Toxicol Appl Pharmacol. 2015 Jul 15;286(2):65-79. doi: 10.1016/j.taap.2015.03.025. Epub 2015 Mar 31. Toxicol Appl Pharmacol. 2015. PMID: 25838073 Free PMC article.
-
Subacute inhalation exposure to ozone induces systemic inflammation but not insulin resistance in a diabetic mouse model.Inhal Toxicol. 2016;28(4):155-63. doi: 10.3109/08958378.2016.1146808. Inhal Toxicol. 2016. PMID: 26986950 Free PMC article.
-
Peripheral metabolic effects of ozone exposure in healthy and diabetic rats on normal or high-cholesterol diet.Toxicol Appl Pharmacol. 2021 Mar 15;415:115427. doi: 10.1016/j.taap.2021.115427. Epub 2021 Jan 30. Toxicol Appl Pharmacol. 2021. PMID: 33524448 Free PMC article.
-
Does ozone inhalation cause adverse metabolic effects in humans? A systematic review.Crit Rev Toxicol. 2021 Jul;51(6):467-508. doi: 10.1080/10408444.2021.1965086. Epub 2021 Sep 27. Crit Rev Toxicol. 2021. PMID: 34569909
Cited by
-
Adrenal-derived stress hormones modulate ozone-induced lung injury and inflammation.Toxicol Appl Pharmacol. 2017 Aug 15;329:249-258. doi: 10.1016/j.taap.2017.06.009. Epub 2017 Jun 13. Toxicol Appl Pharmacol. 2017. PMID: 28623178 Free PMC article.
-
Diets enriched with coconut, fish, or olive oil modify peripheral metabolic effects of ozone in rats.Toxicol Appl Pharmacol. 2021 Jan 1;410:115337. doi: 10.1016/j.taap.2020.115337. Epub 2020 Nov 18. Toxicol Appl Pharmacol. 2021. PMID: 33217375 Free PMC article.
-
Air Pollutant impacts on the brain and neuroendocrine system with implications for peripheral organs: a perspective.Inhal Toxicol. 2023 Mar-Apr;35(3-4):109-126. doi: 10.1080/08958378.2023.2172486. Epub 2023 Feb 7. Inhal Toxicol. 2023. PMID: 36749208 Free PMC article. Review.
-
Benzene Exposure Induces Insulin Resistance in Mice.Toxicol Sci. 2019 Feb 1;167(2):426-437. doi: 10.1093/toxsci/kfy252. Toxicol Sci. 2019. PMID: 30346588 Free PMC article.
-
Subacute Exposure to Gaseous Pollutants from Diesel Engine Exhaust Attenuates Capsaicin-Induced Cardio-Pulmonary Reflex Responses Involving Oxidant Stress Mechanisms in Adult Wistar Rats.Cardiovasc Toxicol. 2024 Apr;24(4):396-407. doi: 10.1007/s12012-024-09842-9. Epub 2024 Mar 7. Cardiovasc Toxicol. 2024. PMID: 38451349
References
-
- Adar SD, Sheppard L, Vedal S, Polak JF, Sampson PD, Diez Roux AV, Budoff M, Jacobs DR, Jr, Barr RG, Watson K, Kaufman JD. Fine particulate air pollution and the progression of carotid intima-medial thickness: a prospective cohort study from the multi-ethnic study of atherosclerosis and air pollution. PLoS Med. 2013;10:e1001430. - PMC - PubMed
-
- Blackburn WD., Jr Validity of acute phase proteins as markers of disease activity. J. Rheumatol. Suppl. 1994;42:9–13. - PubMed
-
- Brennan AM, Mantzoros CS. Drug insight: the role of leptin in human physiology and pathophysiology—emerging clinical applications. Nat. Clin. Pract. Endocrinol. Metab. 2006;2:318–327. - PubMed
-
- Brook RD, Rajagopalan S. Particulate matter air pollution and atherosclerosis. Curr. Atheroscler. Rep. 2010;12:291–300. - PubMed
-
- Brook RDMD, Jerrett MP, Brook JRP, Bard RLMA, Finkelstein MMMDP. The relationship between diabetes mellitus and traffic-related air pollution. J. Occup. Environ. Med. 2008;50:32–38. - PubMed
MeSH terms
Substances
Grants and funding
LinkOut - more resources
Full Text Sources
Other Literature Sources
Medical
Research Materials

