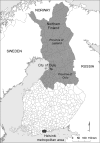
Body mass index and overweight in relation to residence distance and population density: experience from the Northern Finland birth cohort 1966
- PMID: 24103455
- PMCID: PMC3851578
- DOI: 10.1186/1471-2458-13-938
Body mass index and overweight in relation to residence distance and population density: experience from the Northern Finland birth cohort 1966
Abstract
Background: The effect of urban sprawl on body weight in Finland is not well known. To provide more information, we examined whether body mass index (BMI) and the prevalence of overweight are associated with an individual's distance to the local community centre and population density in his/her resident area.
Methods: The sample consisted of 5363 men and women, members of the Northern Finland Birth Cohort 1966 (NFBC), who filled in a postal questionnaire and attended a medical checkup in 1997, at the age of 31 years. Body mass index (BMI; kg/m(2)) and the prevalence of overweight (BMI ≥ 25.0 kg/m(2)) were regressed on each subject's road distance to the resident commune's centre and on population density in the 1 km(2) geographical grid in which he/she resided, using a generalized additive model. Adjustments were made for sex, marital status, occupational class, education, leisure-time and occupational physical activity, alcohol consumption and smoking.
Results: The mean BMI among the subjects was 24.7 kg/m(2), but it increased by increasing road distance (by 1.3 kg/m(2) from 5-10 to 20-184 km) and by decreasing population density (by 1.7 kg/m(2) from 1000-19,192 to 1-5 inhabitants/km(2)). The respective increases in overweight (overall prevalence 41%) were 13 per cent units for distance and 14 per cent units for population density. Adjusted regressions based on continuous explanatory variables showed an inverse L-shaped pattern with a mean BMI of 24.6 kg/m(2) at distances shorter than 5 km and a rise of 2.6 kg/m(2) at longer distances, and an increase of 2.5 kg/m(2) from highest to lowest population density. The associations with road distance were stronger for women than men, while the sex difference in association with population density remained indeterminate.
Conclusions: We conclude that young adults in Northern Finland who live far away from local centres or in the most sparsely populated areas are fatter than those who live close to local centres or in densely populated areas. The likely explanations include variations in everyday physical activity in different residential environments, although causality of the associations remains to be confirmed.
Figures


Similar articles
-
Self-reported health in urban-rural continuum: a grid-based analysis of Northern Finland Birth Cohort 1966.Int J Public Health. 2012 Jun;57(3):525-33. doi: 10.1007/s00038-011-0286-0. Epub 2011 Aug 19. Int J Public Health. 2012. PMID: 21853282
-
Urban/rural differences in body weight: evidence for social selection and causation hypotheses in Finland.Soc Sci Med. 2009 Mar;68(5):867-75. doi: 10.1016/j.socscimed.2008.12.022. Epub 2009 Jan 13. Soc Sci Med. 2009. PMID: 19147263
-
Association of breakfast consumption with body mass index and prevalence of overweight/obesity in a nationally-representative survey of Canadian adults.Nutr J. 2016 Mar 31;15:33. doi: 10.1186/s12937-016-0151-3. Nutr J. 2016. PMID: 27036960 Free PMC article.
-
Village distance from urban centre as the prime modernization variable in differences in blood pressure and body mass index of adults of the Purari delta of the Gulf Province, Papua New Guinea.Ann Hum Biol. 2005 May-Jun;32(3):326-38. doi: 10.1080/03014460500087824. Ann Hum Biol. 2005. PMID: 16099777
-
Prevalence of obesity, central obesity and the associated factors in urban population aged 20-70 years, in the north of Iran: a population-based study and regression approach.Obes Rev. 2007 Jan;8(1):3-10. doi: 10.1111/j.1467-789X.2006.00235.x. Obes Rev. 2007. PMID: 17212790 Review.
Cited by
-
Values, Norms, and Peer Effects on Weight Status.J Obes. 2017;2017:2849674. doi: 10.1155/2017/2849674. Epub 2017 Feb 28. J Obes. 2017. PMID: 28348886 Free PMC article.
-
Urban sprawl, obesity, and cancer mortality in the United States: cross-sectional analysis and methodological challenges.Int J Health Geogr. 2014 Jan 6;13:3. doi: 10.1186/1476-072X-13-3. Int J Health Geogr. 2014. PMID: 24393615 Free PMC article.
-
Urban green space and obesity in older adults: Evidence from Ireland.SSM Popul Health. 2018 Feb 7;4:206-215. doi: 10.1016/j.ssmph.2018.01.002. eCollection 2018 Apr. SSM Popul Health. 2018. PMID: 29552630 Free PMC article.
References
-
- McCann BA, Ewing R. Measuring the health effects of sprawl. A national analysis of physical activity, obesity and chronic disease. Smart Growth America. Surface Transportation Policy Project. Washington DC; 2003. http://smartgrowth.umd.edu/assets/ewingmccann_2003.pdf.
-
- Heliövaara M, Aromaa A. Height, weight and obesity of Finnish adults. Helsinki, Finland: Publications of the Social Insurance Institution, Finland, ML:19; 1980. Finnish, with English summary.
Publication types
MeSH terms
LinkOut - more resources
Full Text Sources
Other Literature Sources

