. 2013 Dec;183(6):1885-1896.
doi: 10.1016/j.ajpath.2013.08.027. Epub 2013 Oct 6.

Canonical transforming growth factor-β signaling regulates disintegrin metalloprotease expression in experimental renal fibrosis via miR-29

Affiliations

Canonical transforming growth factor-β signaling regulates disintegrin metalloprotease expression in experimental renal fibrosis via miR-29

Vasudev Ramdas et al. Am J Pathol. 2013 Dec.

Abstract

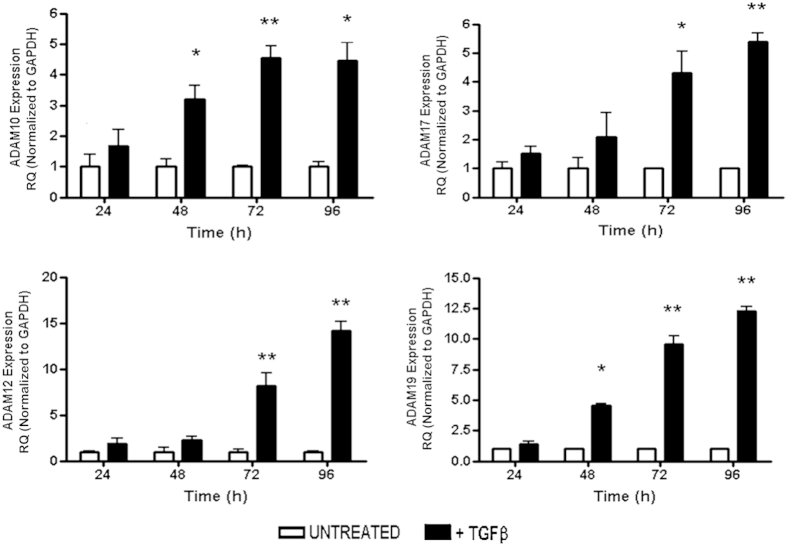
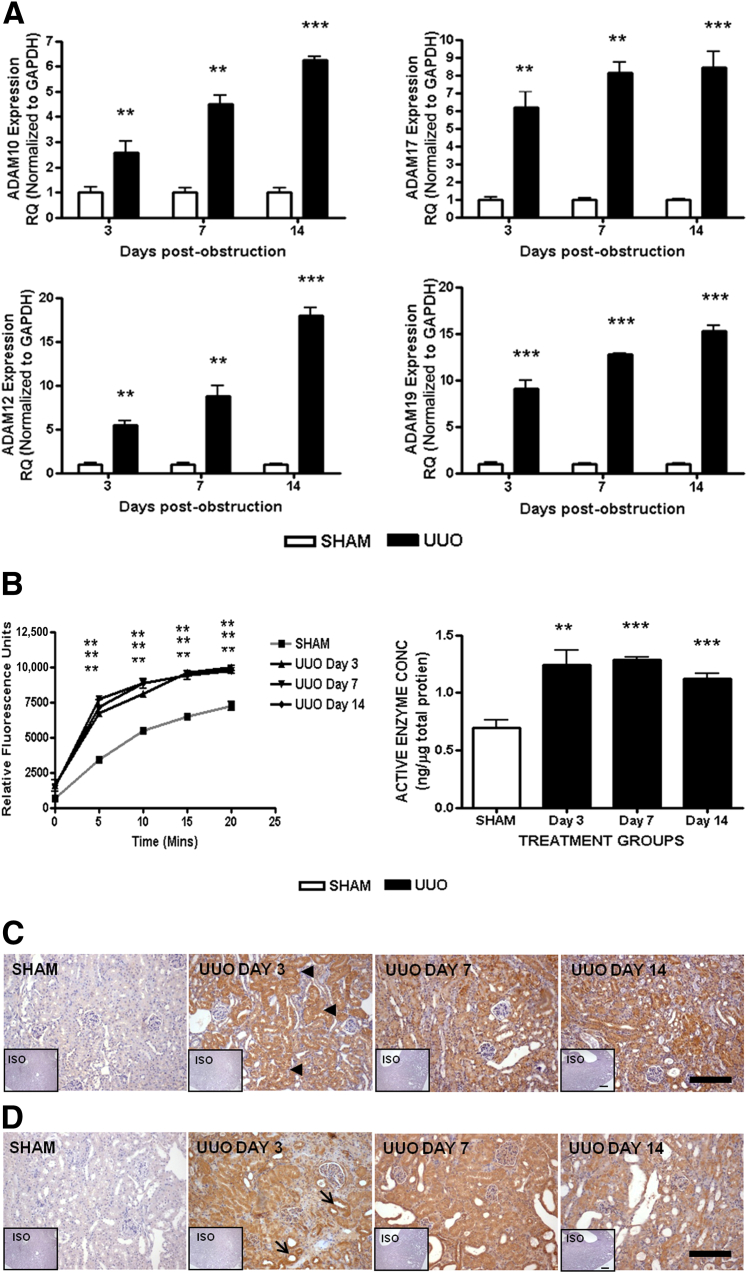
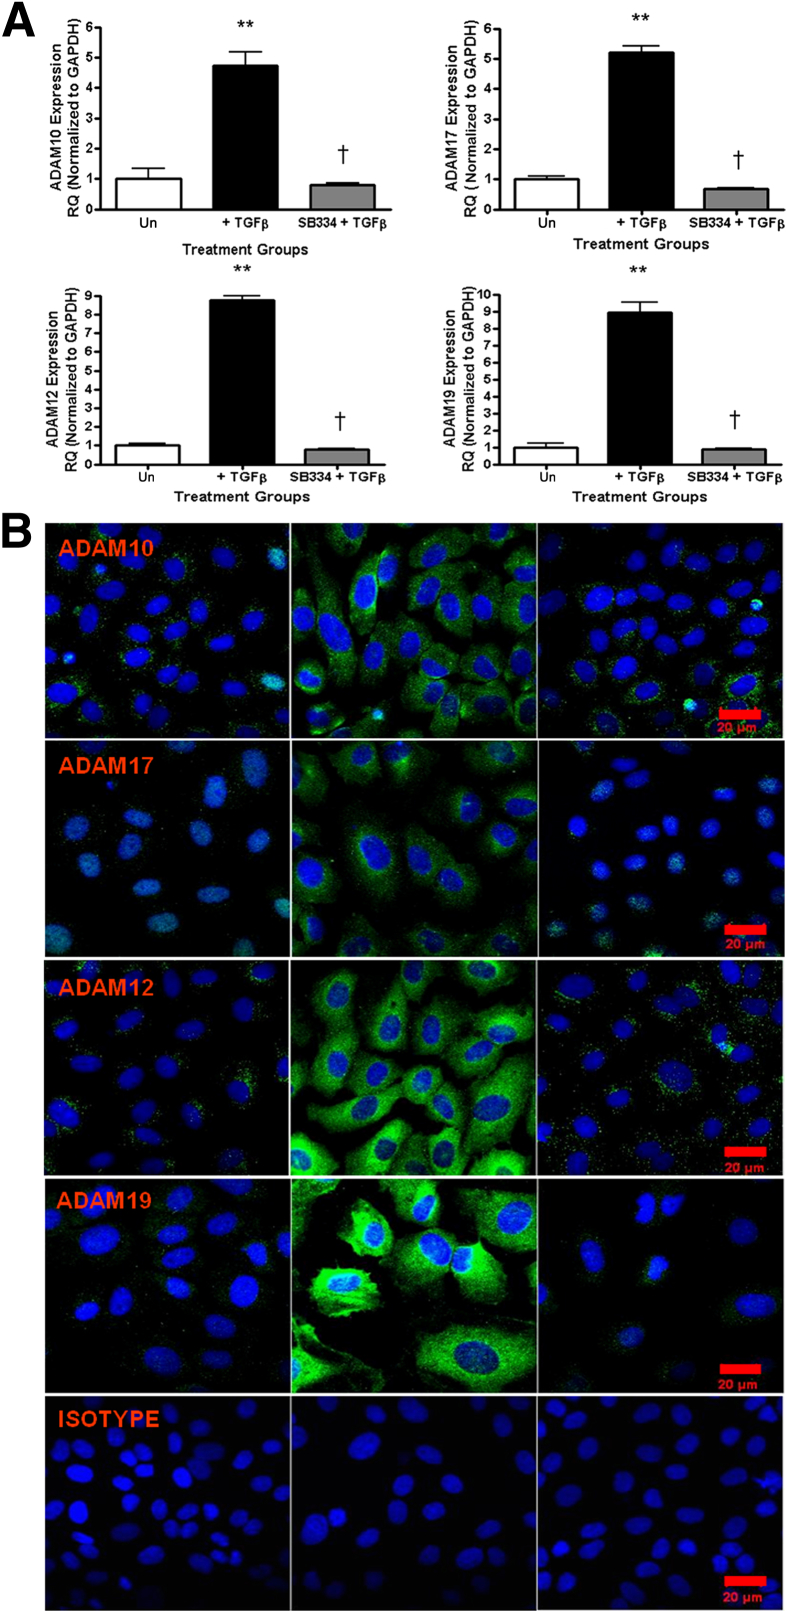
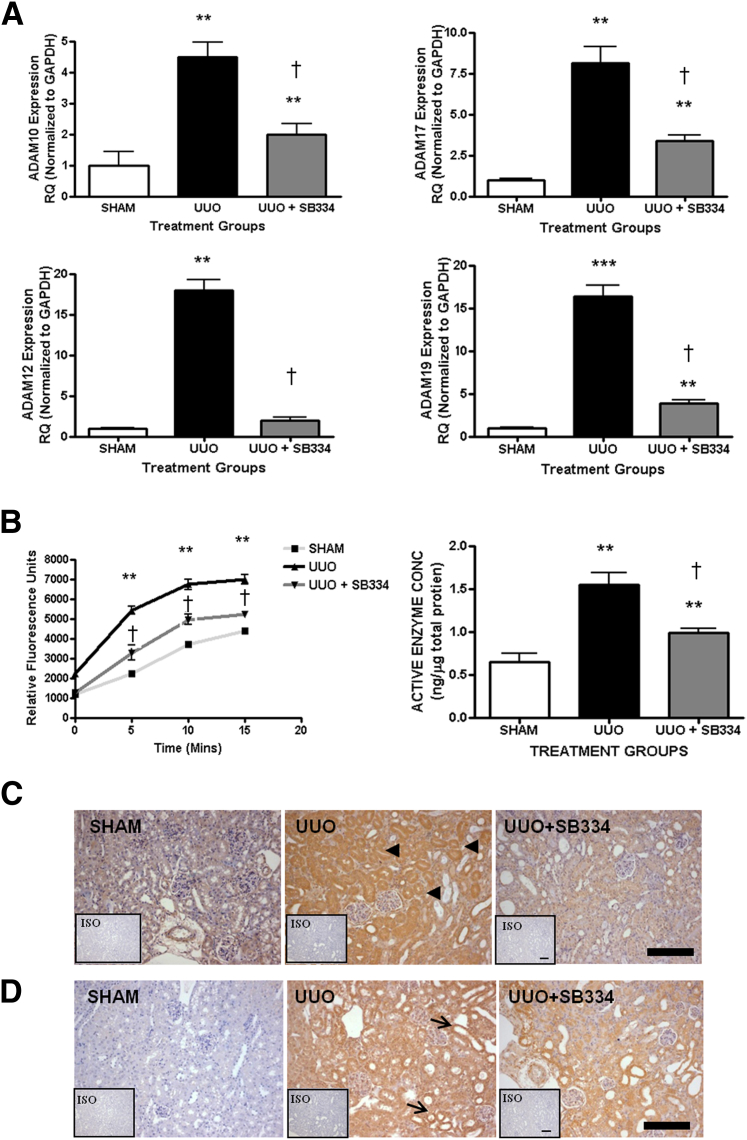
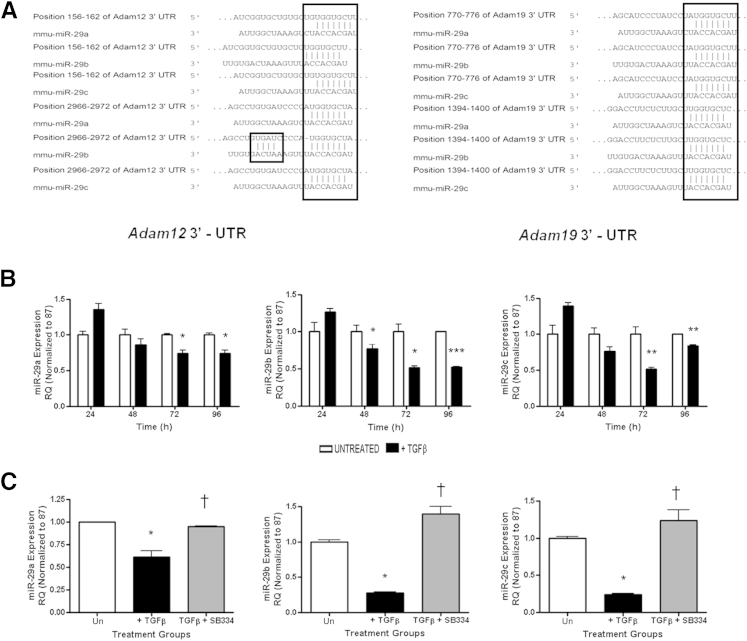
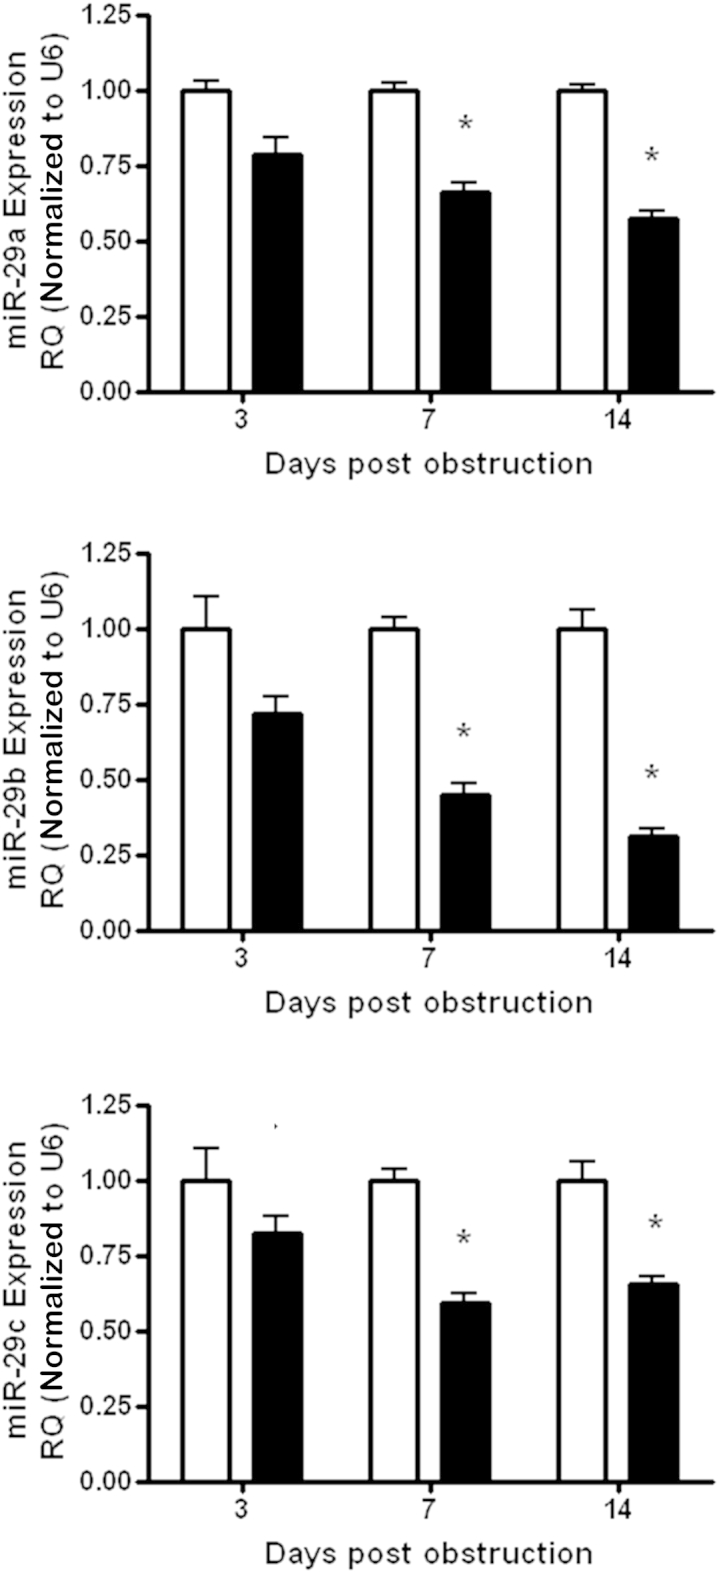
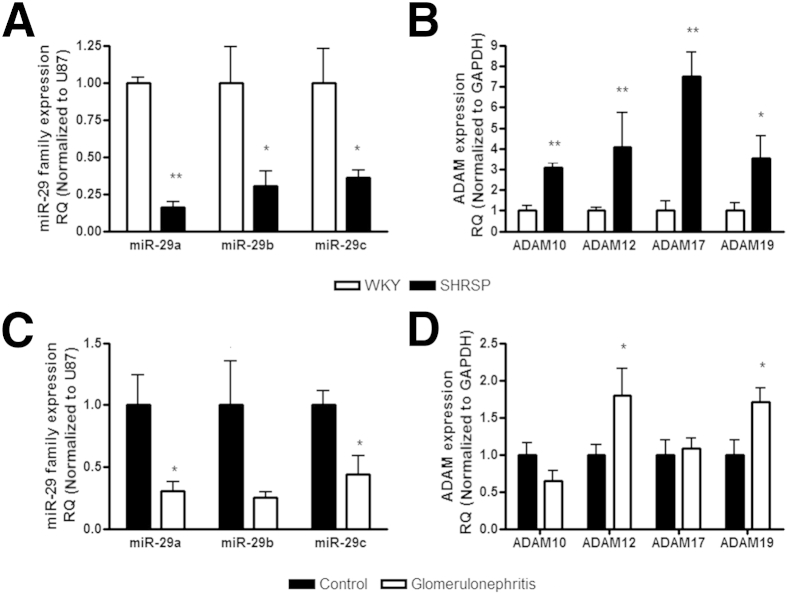
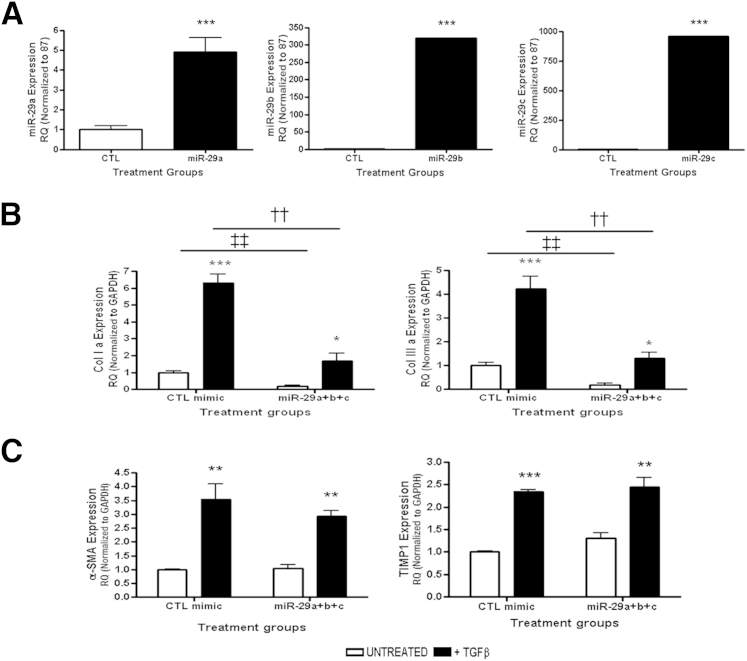
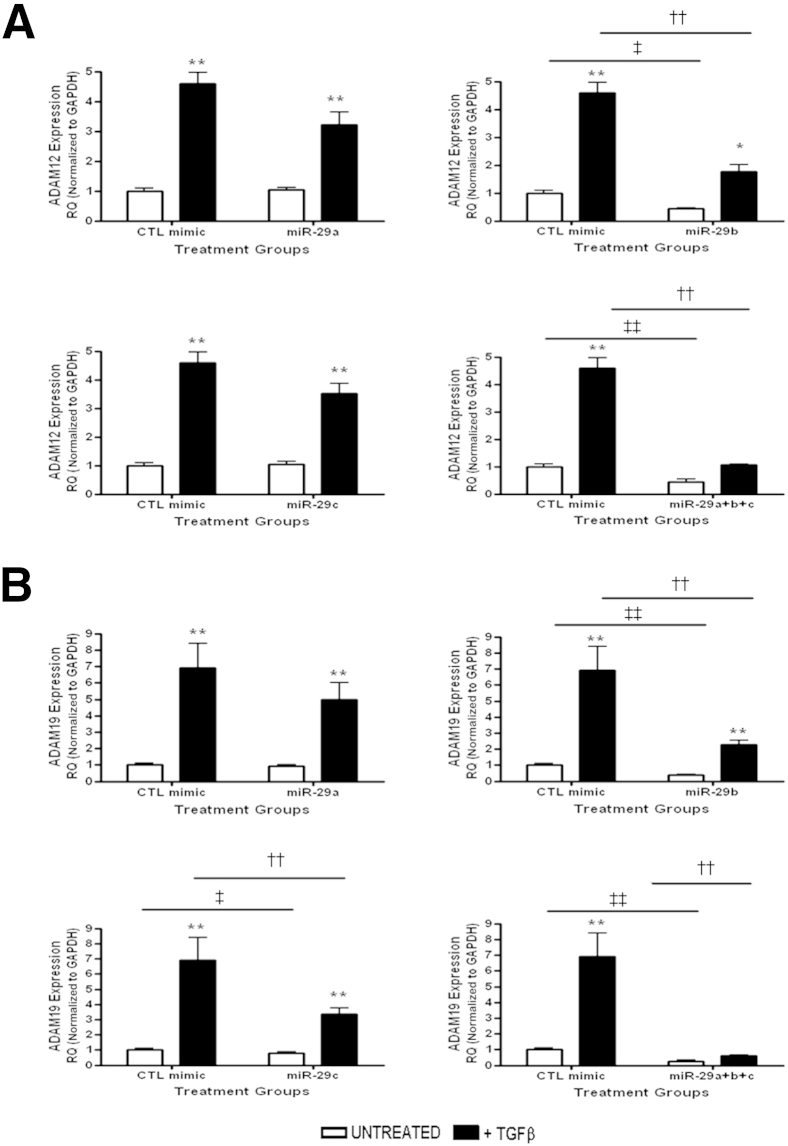
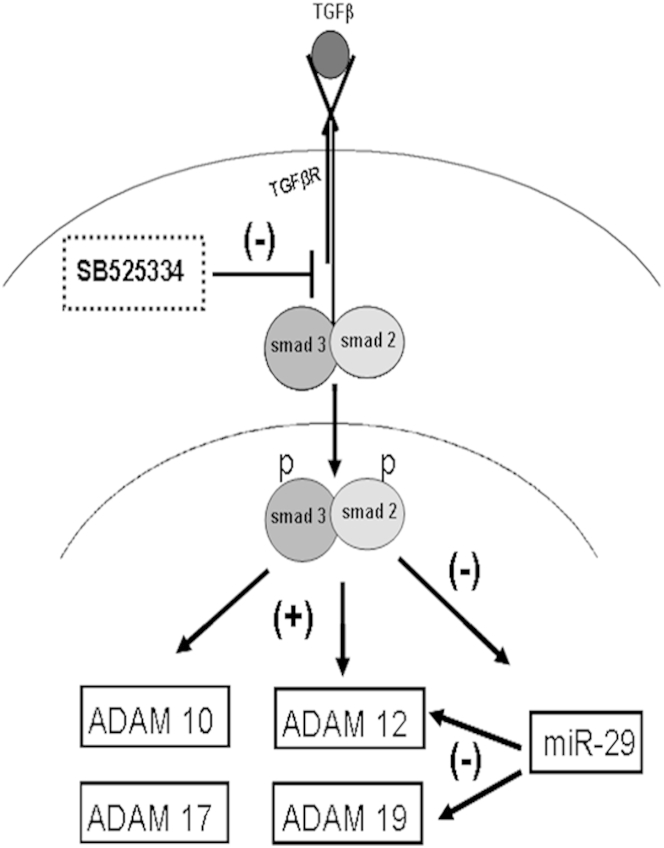
Fibrosis pathophysiology is critically regulated by Smad 2- and Smad 3-mediated transforming growth factor-β (TGF-β) signaling. Disintegrin metalloproteases (Adam) can manipulate the signaling environment, however, the role and regulation of ADAMs in renal fibrosis remain unclear. TGF-β stimulation of renal cells results in a significant up-regulation of Adams 10, 17, 12, and 19. The selective Smad2/3 inhibitor SB 525334 reversed these TGF-β-induced changes. In vivo, using ureteral obstruction to model renal fibrosis, we observed increased Adams gene expression that was blocked by oral administration of SB 525334. Similar increases in Adam gene expression also occurred in preclinical models of hypertension-induced renal damage and glomerulonephritis. miRNAs are a recently discovered second level of regulation of gene expression. Analysis of 3' untranslated regions of Adam12 and Adam19 mRNAs showed multiple binding sites for miR-29a, miR-29b, and miR-29c. We show that miR-29 family expression is decreased after unilateral ureter obstruction and this significant decrease in miR-29 family expression was observed consistently in preclinical models of renal dysfunction and correlated with an increase in Adam12 and Adam19 expression. Exogenous overexpression of the miR-29 family blocked TGF-β-mediated up-regulation of Adam12 and Adam19 gene expression. This study shows that Adams are involved in renal fibrosis and are regulated by canonical TGF-β signaling and miR-29. Therefore, both Adams and the miR-29 family represent therapeutic targets for renal fibrosis.


Figures

Figure 1
Figure 1
Effect of TGF-β on Adam expression in tubular epithelial cells. Rat tubular epithelial NRK52E cells were stimulated with 10 ng/mL TGF-β over a 4-day time course. Gene expression was measured by qPCR using specific TaqMan probes (Life Technologies) for Adam10, Adam17, Adam12, and Adam19 and normalized to glyceraldehyde-3-phosphate dehydrogenase (Gapdh). RQ ± RQmax. P < 0.05, ∗∗P < 0.01 versus unstimulated time-matched controls. Results are representative of three independent experiments. RQ, relative quantification.
Figure 2
Figure 2
Adam expression in kidneys after UUO. RNA was extracted from whole kidneys after UUO surgery. A: Gene expression was measured by qPCR using specific TaqMan probes for Adam10, Adam17, Adam12, and Adam19 and normalized to glyceraldehyde-3-phosphate dehydrogenase (Gapdh). RQ ± RQmax. B: Adam10/17 enzyme activity assay on whole-kidney protein. Fluorescent substrate generation versus time curves. Active enzyme concentrations in whole lysates (ng of enzyme/μg whole protein). Means ± SEM. ∗∗P < 0.01, ∗∗∗P < 0.001 versus sham kidneys. C: Adam12 and Adam19 (D) expression in renal cortex analyzed by immunohistochemistry using specific antibodies. Inset: Isotype (ISO) stained sections. Arrowheads denote proximal tubules, and arrows denote dilating tubules. Scale bars: 100 μm. N = 6 mice per group. RQ, relative quantification.
Figure 3
Figure 3
SB 525334 abrogates TGF-β–induced Adam expression in vitro. A: Gene expression measured by qPCR using specific TaqMan probes for Adam10, Adam17, Adam12, and Adam19 and normalized to glyceraldehyde-3-phosphate dehydrogenase (Gapdh). RQ ± RQmax. ∗∗P < 0.01, versus unstimulated time-matched controls. P < 0.05 versus +TGF-β. B: Immunofluorescent analysis on rat tubular epithelial NRK52E cells after 72 hours TGF-β ± SB 525334 using Adam-specific antibodies. Scale bars: 20 μm. Results are representative of three independent experiments. RQ, relative quantification; Un, unstimulated time matched control cells.
Figure 4
Figure 4
SB 525334 decreases ADAM expression in UUO. A: Gene expression measured on whole-kidney RNA by qPCR using specific TaqMan probes for Adam10, Adam17, Adam12, and Adam19 and normalized to glyceraldehyde-3-phosphate dehydrogenase (Gapdh). RQ ± RQmax. B: Adam10/17 enzyme activity assay on whole-kidney protein. Fluorescent substrate generation versus time curves. Active enzyme concentrations in whole lysates (ng of enzyme/μg whole protein). Means ± SEM. ∗∗P < 0.01, ∗∗∗P < 0.001 versus vehicle sham kidneys. P < 0.05 versus vehicle UUO. ADAM12 (C) and ADAM19 (D) expression in renal cortex analyzed by immunohistochemistry using specific antibodies. Inset: Isotype (ISO) stained sections. Arrowheads denote proximal tubules, and arrows denote dilating tubules. Scale bars: 100 μm. N = 6 mice per group. RQ, relative quantification.
Figure 5
Figure 5
miR-29 expression in rat tubular epithelial NRK52E cells. A: Predicted miR-29 target sites in the Adam12 and Adam19 3′-untranslated regions (UTRs), based on TargetScan Release 5.1 (http://www.targetscan.org, last accessed October 15, 2013). Nucleotides are highlighted in the 3′-UTRs that show exact matches to residues 2 to 8 of the mature miR-29a, miR-29b, and miR-29c. miRNA expression was measured by qPCR using specific TaqMan probes for miR-29a, miR-29b, and miR-29c, and normalized to U87 after TGF-β stimulation at the indicated time points (B), and TGF-β stimulation and SB-525334 inhibitor treatment at 72 hours (C). RQ ± RQmax. P < 0.05, ∗∗P < 0.01, and ∗∗∗P < 0.001 versus unstimulated time-matched controls. P < 0.05 versus CTL+ TGF-β. Results are representative of three independent experiments. RQ, relative quantification; Un, unstimulated time matched controls.
Figure 6
Figure 6
Adam expression in kidneys after UUO. RNA was extracted from whole kidney after UUO surgery. miRNA expression was measured by quantitative RT-PCR using a specific TaqMan probes for miR-29a, miR-29b, and miR-29c, and normalized to U87 after RQ ± RQmax. P < 0.05. n = 6 per group. RQ, relative quantification. White bars indicate sham operated animals; black bars, animals who have undergone UUO surgery.
Figure 7
Figure 7
The miR-29 family and Adam expression correlate in preclinical models of renal damage. A and B: RNA was extracted from whole kidneys from animals at 21 weeks of age (n = 3 to 4 per group). A: The miR-29 family expression was measured by qPCR using specific TaqMan probes for miR-29a, miR-29b, and miR-29c, and normalized to U87. B: Gene expression was measured by qPCR using specific primers and normalized to glyceraldehyde-3-phosphate dehydrogenase (GAPDH). P < 0.05, ∗∗P < 0.01 versus Wistar-Kyoto (WKY). C and D: RNA was extracted from whole kidneys from animals with induced glomerulonephritis and the animals were sacrificed at 7 days. C: The miR-29 family expression was measured by qPCR using specific TaqMan probes for miR-29a, miR-29b, and miR-29c, and normalized to U87. D: Gene expression was measured by qPCR using specific primers and normalized to Gapdh. P < 0.05 versus control. RQ, relative quantification.
Figure 8
Figure 8
miR-29 overexpression in rat tubular epithelial NRK52E cells. A: Exogenous overexpression of the miR-29 family measured by qPCR using specific TaqMan probes for miR-29a, miR-29b, and miR-29c, and normalized to U87. Gene expression of miR-29 targets (B) and nontargets (C) measured by qPCR in NRK52E overexpressing miR-29. RQ ± RQmax. P < 0.05, ∗∗∗P < 0.001 versus unstimulated controls. ††P < 0.01 versus stimulated CTL miR-mimic. ‡‡P < 0.01 versus unstimulated CTL miR-mimic. α-SMA, α-smooth muscle actin; GAPDH, glyceraldehyde-3-phosphate dehydrogenase; TIMP, tissue inhibitor of matrix metalloprotease. RQ, relative quantification.
Figure 9
Figure 9
miR-29 regulates Adam12 and Adam19 in vitro. Gene expression of Adam12 (A) and Adam19 (B) after miR-29 family overexpression. P < 0.05, ∗∗P < 0.01 versus unstimulated controls. ††P < 0.01 versus stimulated CTL miR-mimic. P < 0.05, ‡‡P < 0.01 versus unstimulated CTL miR-mimic. GAPDH, glyceraldehyde-3-phosphate dehydrogenase. CTL, control time matched cells; RQ, relative quantification.
Figure 10
Figure 10
Mechanism of ADAM expression in fibrosis and the Smad2/3-miR-29-ADAM axis. TGF-β binding induces receptor kinase–mediated phosphorylation of Smads 2 and 3. Phosphorylated Smads then translocate to the nucleus and initiate Adam gene expression. p-Smad 2/3 negatively regulates miR-29 expression, the presence of which represses Adam12 and Adam19 expression post-transcriptionally. Treatment with SB-525334 inhibits Smad 2/3 phosphorylation and hence its downstream effects on gene and miRNA expression. These mechanisms combine to result in decreased Adam gene expression.

References

    1. Bohle A., Mackensen-Haen S., von Gise H. Significance of tubulointerstitial changes in the renal cortex for the excretory function and concentration ability of the kidney: a morphometric contribution. Am J Nephrol. 1987;7:421–433. - PubMed
    1. Wynn T.A. Common and unique mechanisms regulate fibrosis in various fibroproliferative diseases. J Clin Invest. 2007;117:524–529. - PMC - PubMed
    1. Bottinger E.P. TGF-beta in renal injury and disease. Semin Nephrol. 2007;27:309–320. - PubMed
    1. Eddy A.A., Neilson E.G. Chronic kidney disease progression. J Am Soc Nephrol. 2006;17:2964–2966. - PubMed
    1. Schnaper H.W., Jandeska S., Runyan C.E., Hubchak S.C., Basu R.K., Curley J.F., Smith R.D., Hayashida T. TGF-beta signal transduction in chronic kidney disease. Front Biosci. 2009;14:2448–2465. - PMC - PubMed

Publication types

MeSH terms

LinkOut - more resources