

Functional tissue units and their primary tissue motifs in multi-scale physiology
- PMID: 24103658
- PMCID: PMC4126067
- DOI: 10.1186/2041-1480-4-22
Functional tissue units and their primary tissue motifs in multi-scale physiology
Abstract
Background: Histology information management relies on complex knowledge derived from morphological tissue analyses. These approaches have not significantly facilitated the general integration of tissue- and molecular-level knowledge across the board in support of a systematic classification of tissue function, as well as the coherent multi-scale study of physiology. Our work aims to support directly these integrative goals.
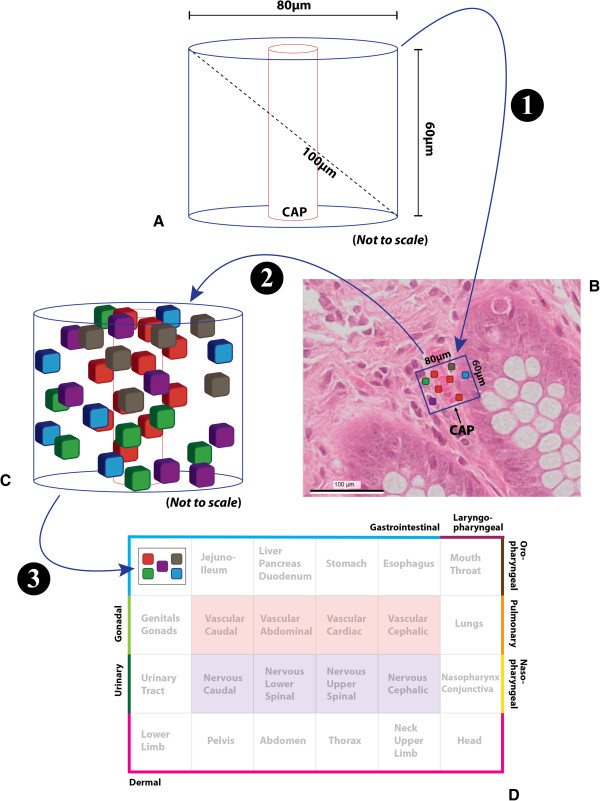
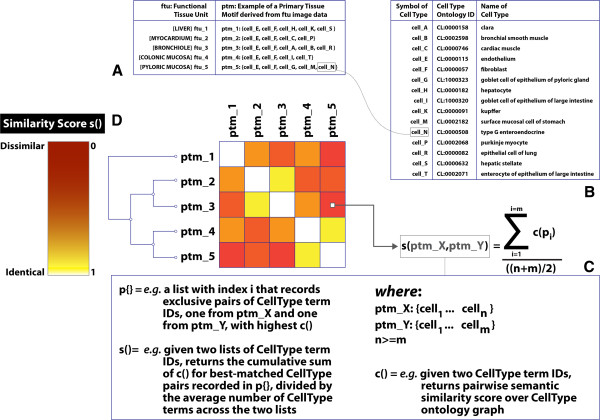
Results: We describe, for the first time, the precise biophysical and topological characteristics of functional units of tissue. Such a unit consists of a three-dimensional block of cells centred around a capillary, such that each cell in this block is within diffusion distance from any other cell in the same block. We refer to this block as a functional tissue unit. As a means of simplifying the knowledge representation of this unit, and rendering this knowledge more amenable to automated reasoning and classification, we developed a simple descriptor of its cellular content and anatomical location, which we refer to as a primary tissue motif. In particular, a primary motif captures the set of cellular participants of diffusion-mediated interactions brokered by secreted products to create a tissue-level molecular network.
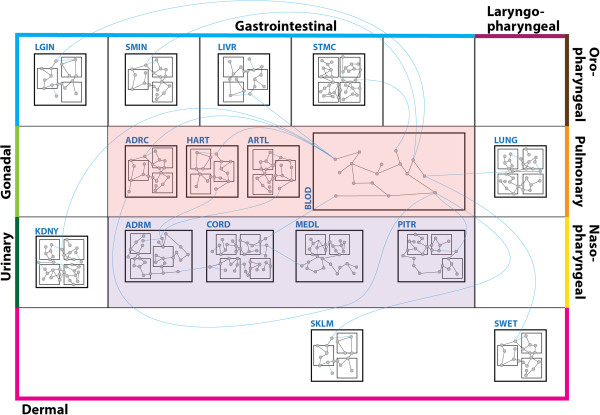
Conclusions: Multi-organ communication, therefore, may be interpreted in terms of interactions between molecular networks housed by interconnected functional tissue units. By extension, a functional picture of an organ, or its tissue components, may be rationally assembled using a collection of these functional tissue units as building blocks. In our work, we outline the biophysical rationale for a rigorous definition of a unit of functional tissue organization, and demonstrate the application of primary motifs in tissue classification. In so doing, we acknowledge (i) the fundamental role of capillaries in directing and radically informing tissue architecture, as well as (ii) the importance of taking into full account the critical influence of neighbouring cellular environments when studying complex developmental and pathological phenomena.
Figures
Similar articles
-
The Effectiveness of Integrated Care Pathways for Adults and Children in Health Care Settings: A Systematic Review.JBI Libr Syst Rev. 2009;7(3):80-129. doi: 10.11124/01938924-200907030-00001. JBI Libr Syst Rev. 2009. PMID: 27820426
-
How has the impact of 'care pathway technologies' on service integration in stroke care been measured and what is the strength of the evidence to support their effectiveness in this respect?Int J Evid Based Healthc. 2008 Mar;6(1):78-110. doi: 10.1111/j.1744-1609.2007.00098.x. Int J Evid Based Healthc. 2008. PMID: 21631815
-
The future of Cochrane Neonatal.Early Hum Dev. 2020 Nov;150:105191. doi: 10.1016/j.earlhumdev.2020.105191. Epub 2020 Sep 12. Early Hum Dev. 2020. PMID: 33036834
-
Molecular Recognition in the Colloidal World.Acc Chem Res. 2017 Nov 21;50(11):2756-2766. doi: 10.1021/acs.accounts.7b00370. Epub 2017 Oct 6. Acc Chem Res. 2017. PMID: 28984441 Review.
-
Modular Tissue Assembly Strategies for Biofabrication of Engineered Cartilage.Ann Biomed Eng. 2017 Jan;45(1):100-114. doi: 10.1007/s10439-016-1609-3. Epub 2016 Apr 12. Ann Biomed Eng. 2017. PMID: 27073109 Review.
Cited by
-
Anatomical structures, cell types, and biomarkers of the healthy human blood vasculature.Sci Data. 2023 Jul 19;10(1):452. doi: 10.1038/s41597-023-02018-0. Sci Data. 2023. PMID: 37468503 Free PMC article.
-
Segmentation of human functional tissue units in support of a Human Reference Atlas.Commun Biol. 2023 Jul 19;6(1):717. doi: 10.1038/s42003-023-04848-5. Commun Biol. 2023. PMID: 37468557 Free PMC article.
-
Biophysical constraints on the evolution of tissue structure and function.J Physiol. 2014 Jun 1;592(11):2389-401. doi: 10.1113/jphysiol.2014.273235. J Physiol. 2014. PMID: 24882821 Free PMC article.
-
Functional tissue units in the Human Reference Atlas.Nat Commun. 2025 Feb 11;16(1):1526. doi: 10.1038/s41467-024-54591-6. Nat Commun. 2025. PMID: 39934102 Free PMC article.
-
Hyperedge Representations with Hypergraph Wavelets: Applications to Spatial Transcriptomics.ArXiv [Preprint]. 2024 Sep 14:arXiv:2409.09469v1. ArXiv. 2024. PMID: 39314512 Free PMC article. Preprint.
References
-
- Hulikova A, Harris AL, Vaughan-Jones RD, Swietach P. Acid-extrusion from tissue: the interplay between membrane transporters and pH buffers. Curr Pharm Des. 2012;4(10):1331–1337. - PubMed
-
- Sassoli C, Pini A, Mazzanti B, Quercioli F, Nistri S, Saccardi R, Zecchi-Orlandini S, Bani D, Formigli L. Mesenchymal stromal cells affect cardiomyocyte growth through juxtacrine Notch-1/Jagged-1 signaling and paracrine mechanisms: clues for cardiac regeneration. J Mol Cell Cardiol. 2011;4(3):399–408. - PubMed
-
- Adams GR. "Autocrine and/or paracrine insulin-like growth factor-I activity in skeletal muscle". Clin Orthop Relat Res. 2002;4:S188–S196. Suppl. - PubMed
-
- Alkemade A. Central and peripheral effects of thyroid hormone signalling in the control of energy metabolism. J Neuroendocrinol. 2010;4(1):56–63. - PubMed
-
- Mestecky J. Homeostasis of the mucosal immune system: human milk and lactation. Adv Exp Med Biol. 2001;4:197–205. - PubMed
Grants and funding
LinkOut - more resources
Full Text Sources
Other Literature Sources
Research Materials
