. 2014 Jan;42(1):276-89.
doi: 10.1093/nar/gkt895. Epub 2013 Oct 7.

Regions outside the DNA-binding domain are critical for proper in vivo specificity of an archetypal zinc finger transcription factor

Affiliations

Regions outside the DNA-binding domain are critical for proper in vivo specificity of an archetypal zinc finger transcription factor

Jon Burdach et al. Nucleic Acids Res. 2014 Jan.

Abstract

Transcription factors (TFs) are often regarded as being composed of a DNA-binding domain (DBD) and a functional domain. The two domains are considered separable and autonomous, with the DBD directing the factor to its target genes and the functional domain imparting transcriptional regulation. We examined an archetypal zinc finger (ZF) TF, Krüppel-like factor 3 with an N-terminal domain that binds the corepressor CtBP and a DBD composed of three ZFs at its C-terminus. We established a system to compare the genomic occupancy profile of wild-type Krüppel-like factor 3 with two mutants affecting the N-terminal functional domain: a mutant unable to contact the cofactor CtBP and a mutant lacking the entire N-terminal domain, but retaining the ZFs intact. Chromatin immunoprecipitation followed by sequencing was used to assess binding across the genome in murine embryonic fibroblasts. Unexpectedly, we observe that mutations in the N-terminal domain generally reduced binding, but there were also instances where binding was retained or even increased. These results provide a clear demonstration that the correct localization of TFs to their target genes is not solely dependent on their DNA-contact domains. This informs our understanding of how TFs operate and is of relevance to the design of artificial ZF proteins.


Figures

Figure 1.
Figure 1.
Experimental model for investigating KLF3 occupancy. (A) Schematic showing the three constructs used to rescue Klf3−/− MEFs. (B) Western blot and (C) real-time RT-PCR showing relative levels of ectopic protein and mRNA expression of the three constructs in rescued Klf3−/− MEFs. For real-time RT-PCR, expression has been normalized to 18 S rRNA and is shown relative to the KLF3 rescue, which has been set to 1.0. Shown are the means of either two (ΔDL and DBD) or three (KLF3) independent experiments. Error bars represent standard deviation. (D) Western blot showing endogenous KLF3 in Klf3+/+ MEFs and ectopic KLF3 in Klf3−/− MEFs recued with Klf3-V5.
Figure 2.
Figure 2.
Genomic localization of KLF3 peaks. (A) Distribution of KLF3 peaks within different genomic regions. Promoters are defined as the region −1000 bp, +100 bp around the TSS of Refseq genes. Peaks that fell into CDS exons, 5′ and 3′ UTR exons and transcription termination sites (−100 bp to +1 kb) were all labeled as ‘other’. Percentages lying in each region are given, and absolute peak numbers are shown in parentheses. (B) Histogram of peak centers within 1.5 kb of the Refseq TSS with 20 bp bins.
Figure 3.
Figure 3.
A selection of putative KLF3 target genes. Genes displayed were repressed >2-fold on rescue with KLF3 and also exhibit a ChIP peak at the proximal promoter. DNase-seq and RNAP II ChIP-seq tracks generated from experiments from the Ren and Stamatoyannopoulos Laboratories, respectively, are also displayed. Both were sourced from the ENCODE project (25–27). Gene expression changes are based on microarray data and have passed a P < 0.05 cutoff as measured by one-way analysis of variance. Error bars represent standard error of the mean.
Figure 4.
Figure 4.
Characterization of the KLF3 consensus DNA-binding site. (A) The KLF3 consensus binding site derived from KLF3 ChIP-seq peaks. De novo motif discovery was accomplished using MEME on a sequence database composed of the 100 bp surrounding the top 500 peaks ranked by peak height. (B) KLF1 consensus binding motif from a ChIP-seq experiment on erythroid cells (38). (C) KLF4 consensus binding site from ChIP-seq on ES cells (7). (D) Cumulative distribution of KLF3 consensus motifs within KLF3 ChIP-seq peaks. (E) Relationship between peak height and KLF3 motif count within the peak. Motif counts were established using HOMER and the mean peak height was taken. Error bars represent the standard error of the mean. (F) EMSA showing the effect of mutation of the KLF3 consensus on DNA-binding strength. Point mutations were introduced at each position of a β-globin CACCC probe (18) as indicated. COS and WT lanes contain wild-type β-globin probe; COS lane contains nuclear extracts from cells transfected with empty pMT3 vector. Probe sequences are given in Supplementary Table S2.
Figure 5.
Figure 5.
An illustrative range of peaks showing similarities and differences between the occupancy of KLF3, ΔDL and DBD. Notable changes in occupancy are highlighted by red vertical bars.The y-axis scales may differ between panels but that within a panel, KLF3, ΔDL and DBD tracks use the same scale to allow direct comparison of peak height. The DNase-seq track was generated from fibroblast data from the Stamatoyannopoulos Laboratory and was sourced from the ENCODE project (25,26).
Figure 6.
Figure 6.
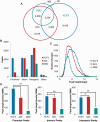
Contrasting KLF3, ΔDL and DBD peaks. (A) Proportional Venn diagram showing the overlap of peaks between the three proteins. (B) Distribution of KLF3 and mutant peaks across the genome. Promoters are defined as the region −1000 bp, +100 bp around the TSS of Refseq genes. Peaks that fell into CDS exons, 5′ and 3′ UTR exons and transcription termination sites (−100 bp to +1 kb) were all labeled as ‘other’. (C) Histogram showing the distribution of peak heights across KLF3 and the two mutants. (D) Differences in peak heights between KLF3 and KLF3 mutants at various genomic regions. Values are mean peak heights (reads/100 M reads within 400 bp of peak centers). Error bars represent standard error of the mean. *P < 0.05 **P < 0.00005.
Figure 7.
Figure 7.
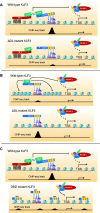
Simple models offer potential explanations for observed changes in occupancy. (A) CtBP is known to dimerize and can associate with >30 other mammalian TFs (45). It is possible that such interactions may stabilize wild-type KLF3 at certain genomic regions. (B) CtBP can modify chromatin domains via recruitment of a range of histone modifying enzymes. CtBP’s action at some regulatory elements may reduce occupancy by making chromatin less permissive. When KLF3 cannot properly recruit CtBP due to the ΔDL mutation, occupancy may increase as a result of chromatin being more open. (C) The DBD mutant shows higher DNA binding in vitro and also lacks the N-terminal domain that recruits CtBP. These two changes may lead to a decreased level of DNA-binding specificity with a concomitant increase in DNA-binding affinity potentially explaining the reduced occupancy observed genome-wide.

References

    1. Tsang AP, Visvader JE, Turner CA, Fujiwara Y, Yu C, Weiss MJ, Crossley M, Orkin SH. FOG, a multitype zinc finger protein, acts as a cofactor for transcription factor GATA-1 in erythroid and megakaryocytic differentiation. Cell. 1997;90:109–119. - PubMed
    1. Chlon TM, Dore LC, Crispino JD. Cofactor-mediated restriction of GATA-1 chromatin occupancy coordinates lineage-specific gene expression. Mol. Cell. 2012;47:608–621. - PMC - PubMed
    1. Kassouf MT, Hughes JR, Taylor S, McGowan SJ, Soneji S, Green AL, Vyas P, Porcher C. Genome-wide identification of TAL1's functional targets: insights into its mechanisms of action in primary erythroid cells. Genome Res. 2010;20:1064–1083. - PMC - PubMed
    1. Fujiwara T, O'Geen H, Keles S, Blahnik K, Linnemann AK, Kang YA, Choi K, Farnham PJ, Bresnick EH. Discovering hematopoietic mechanisms through genome-wide analysis of GATA factor chromatin occupancy. Mol. Cell. 2009;36:667–681. - PMC - PubMed
    1. Wasserman WW, Sandelin A. Applied bioinformatics for the identification of regulatory elements. Nat. Rev. Genet. 2004;5:276–287. - PubMed

Publication types

Associated data