. 2013 Nov 29;288(48):34443-58.
doi: 10.1074/jbc.M113.486936. Epub 2013 Oct 8.

Structures of the substrate-free and product-bound forms of HmuO, a heme oxygenase from corynebacterium diphtheriae: x-ray crystallography and molecular dynamics investigation

Affiliations

Structures of the substrate-free and product-bound forms of HmuO, a heme oxygenase from corynebacterium diphtheriae: x-ray crystallography and molecular dynamics investigation

Masaki Unno et al. J Biol Chem. .

Abstract

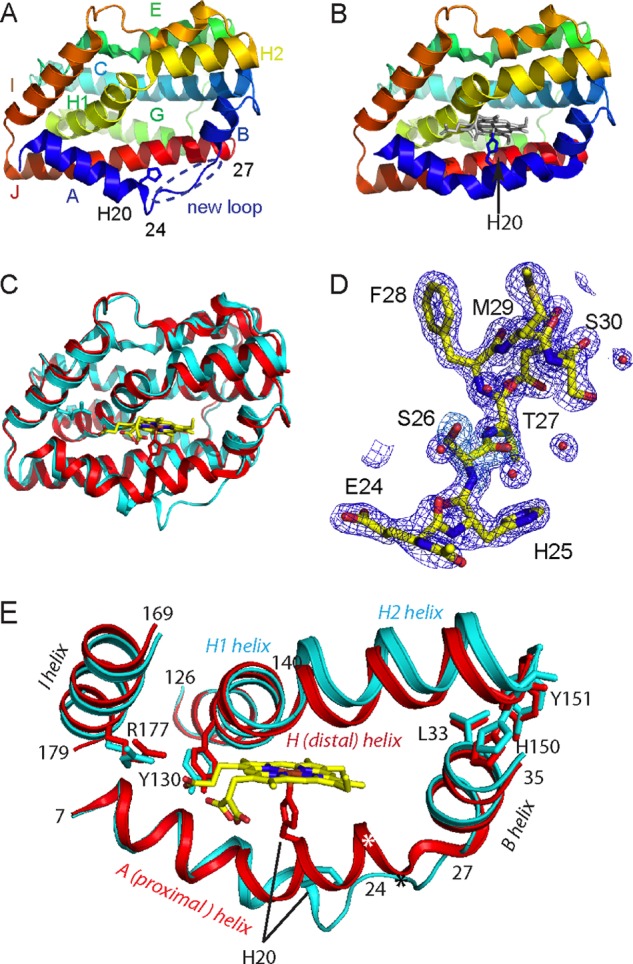
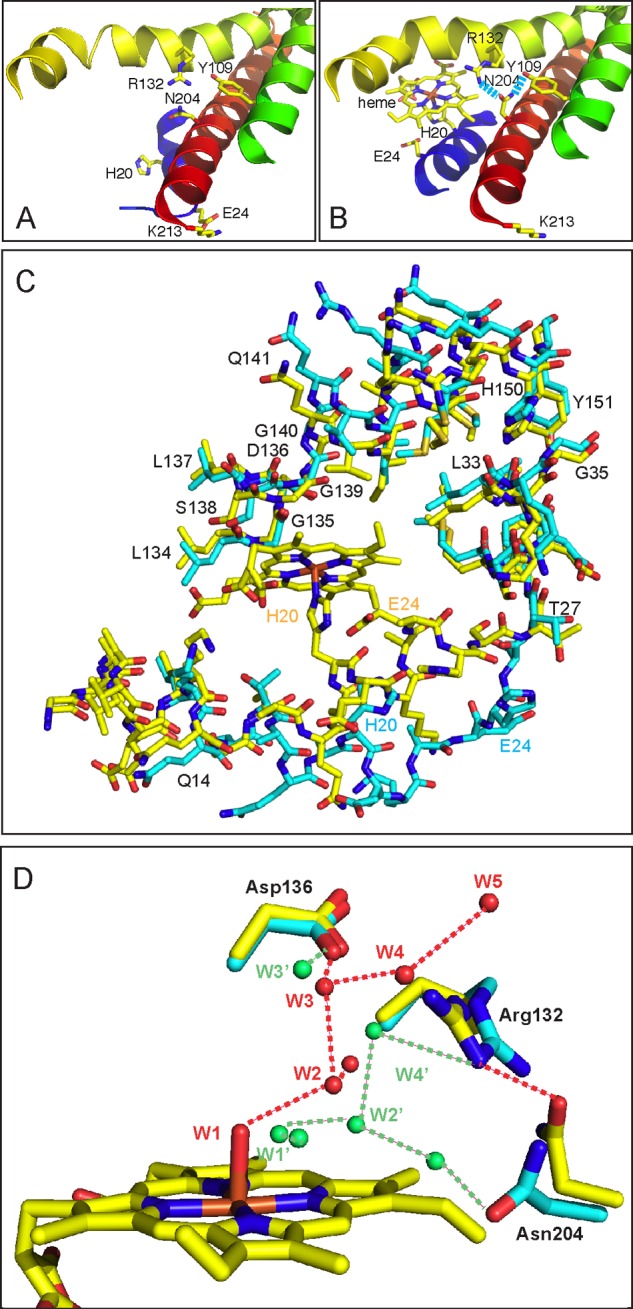
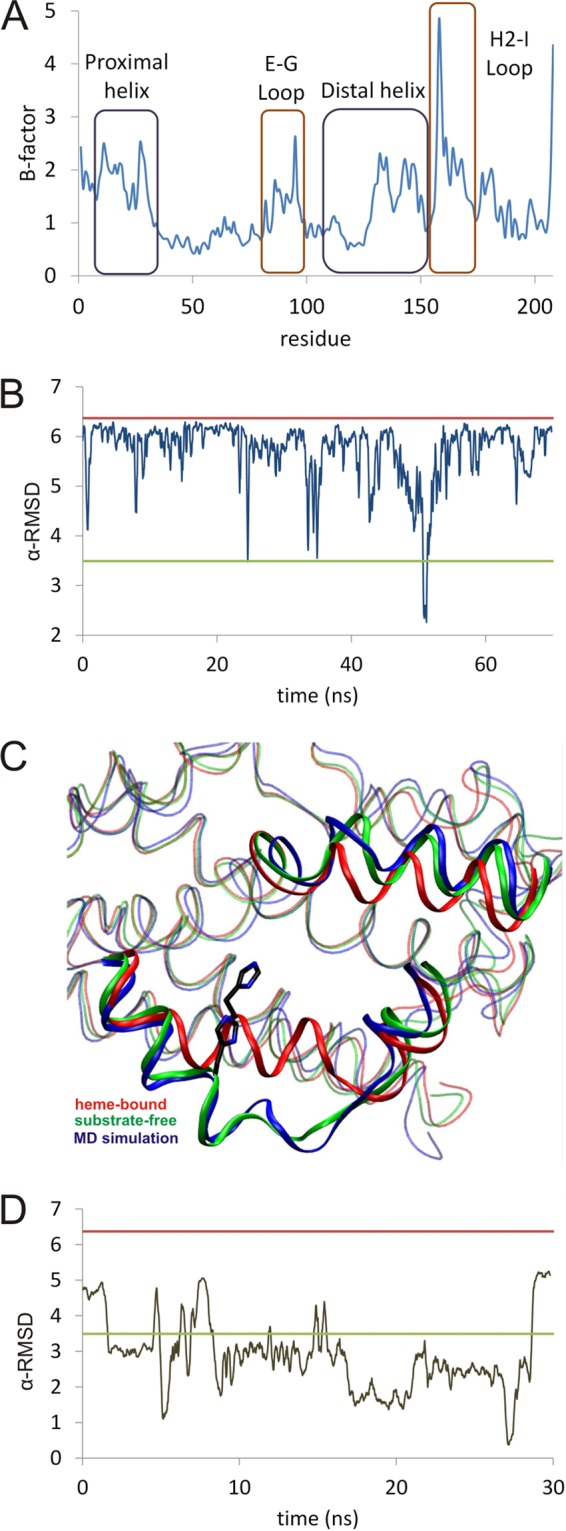
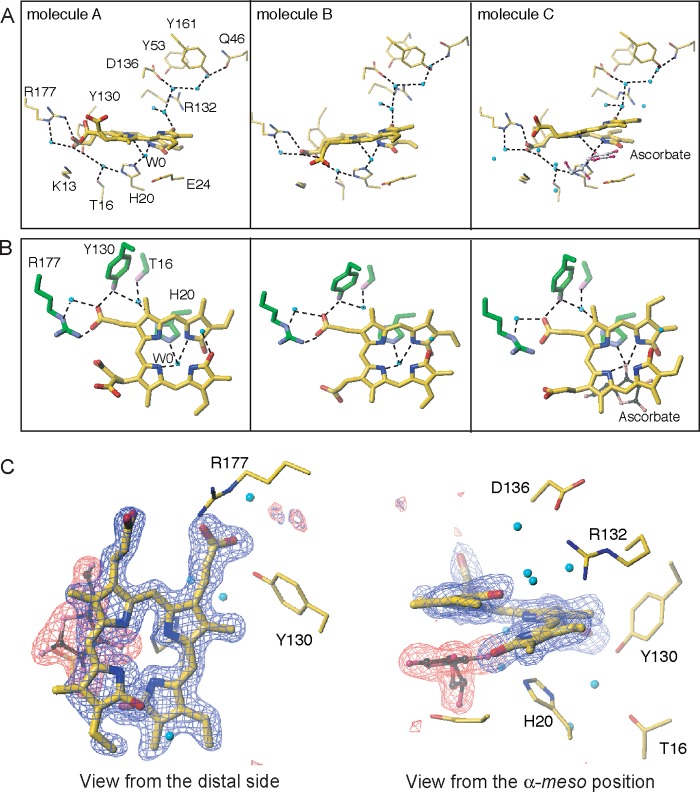
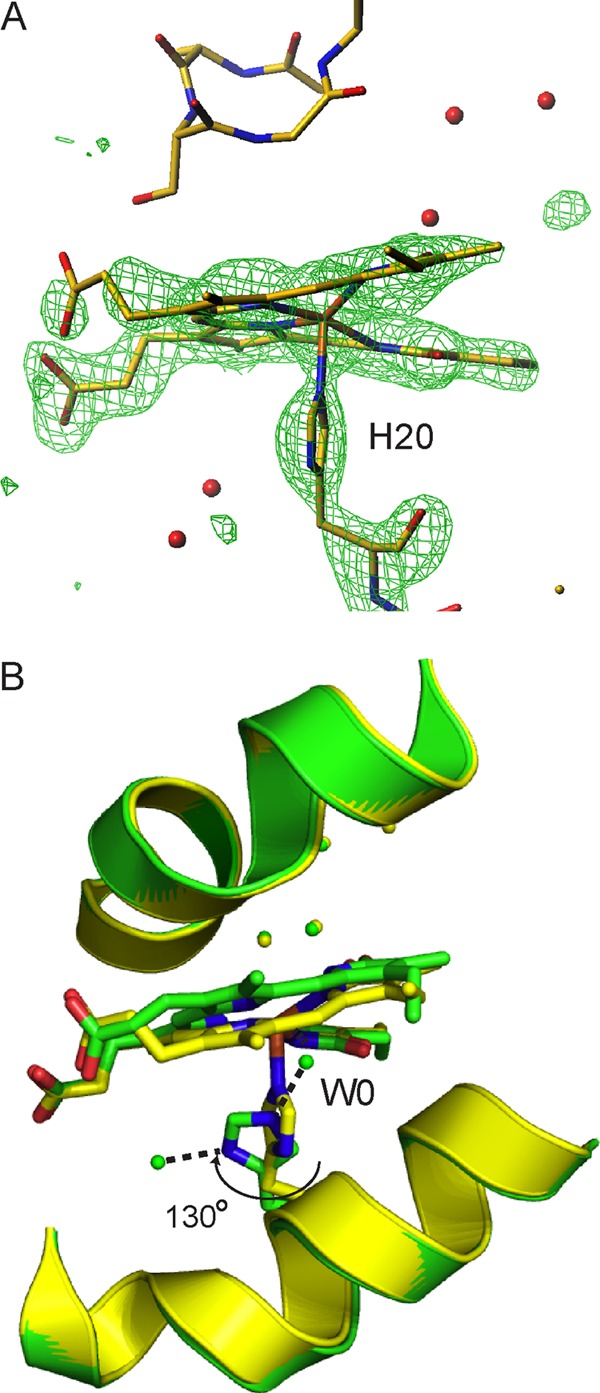
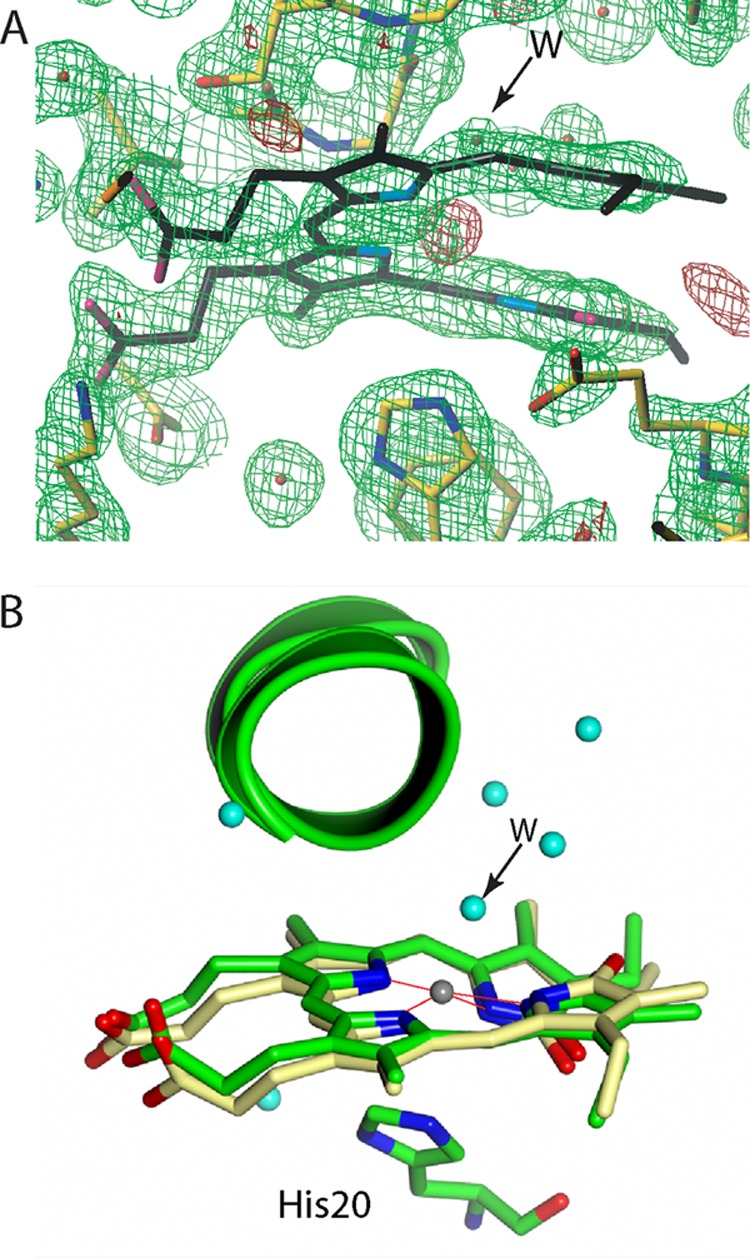
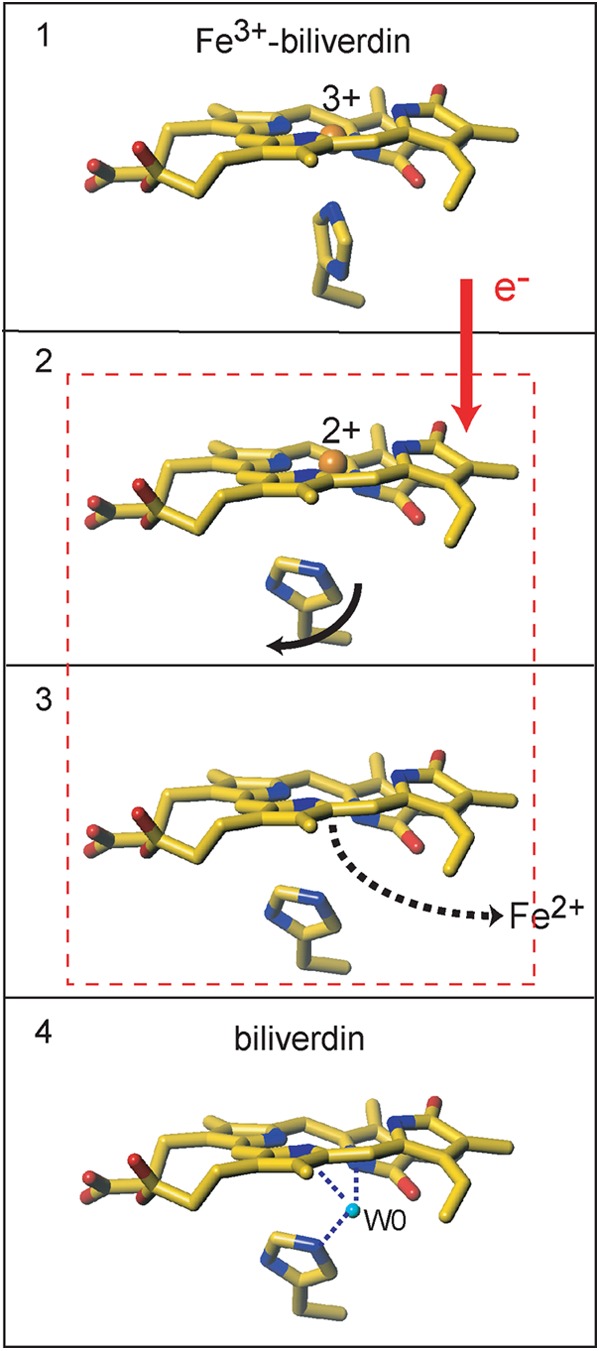
Heme oxygenase catalyzes the degradation of heme to biliverdin, iron, and carbon monoxide. Here, we present crystal structures of the substrate-free, Fe(3+)-biliverdin-bound, and biliverdin-bound forms of HmuO, a heme oxygenase from Corynebacterium diphtheriae, refined to 1.80, 1.90, and 1.85 Å resolution, respectively. In the substrate-free structure, the proximal and distal helices, which tightly bracket the substrate heme in the substrate-bound heme complex, move apart, and the proximal helix is partially unwound. These features are supported by the molecular dynamic simulations. The structure implies that the heme binding fixes the enzyme active site structure, including the water hydrogen bond network critical for heme degradation. The biliverdin groups assume the helical conformation and are located in the heme pocket in the crystal structures of the Fe(3+)-biliverdin-bound and the biliverdin-bound HmuO, prepared by in situ heme oxygenase reaction from the heme complex crystals. The proximal His serves as the Fe(3+)-biliverdin axial ligand in the former complex and forms a hydrogen bond through a bridging water molecule with the biliverdin pyrrole nitrogen atoms in the latter complex. In both structures, salt bridges between one of the biliverdin propionate groups and the Arg and Lys residues further stabilize biliverdin at the HmuO heme pocket. Additionally, the crystal structure of a mixture of two intermediates between the Fe(3+)-biliverdin and biliverdin complexes has been determined at 1.70 Å resolution, implying a possible route for iron exit.

Keywords: Bacterial Iron Acquisition; Enzyme Structure; Heme; Heme Oxygenase; Molecular Dynamics; X-ray Crystallography.


Figures

FIGURE 1.
FIGURE 1.
Overall structure of the substrate-free HmuO and the ferric heme-HmuO complex. A and B, Cα traces of the substrate-free HmuO (A) and the ferric heme-HmuO complex (B). Each helix is labeled as A to J from the N terminus. C, superposition of the substrate-free HmuO and the ferric heme-HmuO complex. The substrate-free and heme-bound forms are colored in cyan and red, respectively. D, simulated annealed composite omit 2FoFc map around the new loop region (Glu-24 to Phe-28) of HmuO at the 1.0 σ level. E, models for the proximal (helix A, residue 7–26), distal (helix H, residue 126–151), B (residue 28–35), and I (residue 169–179) helices are superimposed to minimize the r.m.s. deviation of the corresponding main chain atoms of all the amino acid residues. The substrate-free from is colored in cyan and the heme complex in red. The asterisk denotes the positions of the Glu-24 Cα atoms. These figures were prepared by PyMOL (44).
FIGURE 2.
FIGURE 2.
Comparison of the heme pockets of the substrate-free HmuO to that of the ferric heme-HmuO complex. A and B, ribbon diagrams of the vicinity of the heme pocket of the substrate-free HmuO (A) and the ferric heme-HmuO complex (B). C, superposition of the heme-binding site of the substrate-free HmuO and the ferric heme-HmuO complex. For both structures, the nitrogen, oxygen, sulfur, and iron atoms are colored in blue, red, ochre, and orange, respectively. The carbon atoms of the heme-HmuO complex and those of the substrate-free HmuO are colored in yellow and cyan, respectively. D, superposition of the distal heme pockets of the substrate-free HmuO and the ferric heme-HmuO complex. The same color scheme as C is used except for the water oxygen atoms that are colored in red for the heme complex and green for the substrate-free form. These figures were prepared with PyMOL (44).
FIGURE 3.
FIGURE 3.
A, estimated r.m.s. deviation per residue from the MD trajectory; B, time dependence of the value of α-RMSD versus time. B, red line is the calculated value for the crystal structure of the heme-HmuO complex. The green line is the value calculated for the crystal structure of the substrate-free form of HmuO, and the blue line is the molecular dynamics structure. A running average of each 100 data values is taken. C, comparison between the backbone of the crystallographic substrate-free (green), the heme-bound complex (red), and a representative snapshot of the molecular dynamics simulation during the 45–55-ns time window (blue). D, time dependence of the value of α-RMSD versus time for the substrate-free form of HmuO.
FIGURE 4.
FIGURE 4.
Close-up view of the biliverdin-binding sites in the biliverdin-HmuO complex. A, distal heme pocket water hydrogen bond network and significant residues. Molecules A, B, and C are depicted from left to right. In molecule C, the ascorbate molecule (gray for carbon atoms and magenta for oxygen atoms) is found between the biliverdin and His-20. B, close-up view of the biliverdin-binding site viewed from the distal side. The nitrogen, oxygen, and carbon atoms of the HmuO protein are colored in purple, pink, and green, respectively. The biliverdin molecules are shown in blue, red, and yellow for the nitrogen, oxygen, and carbon atoms, respectively. All water molecules are colored in cyan. C, simulated annealed omit FoFc maps for biliverdin (blue cage) and ascorbate (red cage) in molecule C at the 3.7 σ level viewed from two directions. The figures were prepared with Turbo-Frodo (39).
FIGURE 5.
FIGURE 5.
Comparison of the biliverdin structures. A, biliverdin complex of HmuO (left panel) is compared with that of human HO-1 (right panel) (PDB 1S8C (31)). B, overlay of the biliverdin groups reported for free biliverdin dimethyl ester in magenta (32), biliverdin in apoMb in cyan (33), biliverdin in HmuO in green (this work), and biliverdin in human HO-1 in yellow (31). The figures were prepared with PyMOL (44).
FIGURE 6.
FIGURE 6.
Structure of the Fe3+-biliverdin complex and comparison with that of the biliverdin complex. A, omit map of the Fe3+-biliverdin group and His-20 countered at the 3.0 σ level are illustrated by an overlay onto the Fe3+-biliverdin and His-20 structures. The distal residues and nearby water molecules are also included. B, superimposition of the Fe3+-biliverdin HmuO (yellow) and the biliverdin-HmuO (green) complexes. In the biliverdin complex model, the carbon, nitrogen, and oxygen atoms of His-20 and biliverdin are shown in green, blue, and red, respectively, and water molecules are in green. In the Fe3+-biliverdin complex model, the carbon, nitrogen, oxygen, and iron atoms of His-20 and Fe3+-biliverdin are shown in yellow, blue, red, and orange, respectively, and water molecules are in yellow. These figures were prepared with Turbo-Frodo (39) for A and with PyMOL (44) for B.
FIGURE 7.
FIGURE 7.
Vicinity of biliverdin in the intermediate states. A, electron density maps of a mixture of the intermediates during the iron release for molecule A drawn with Turbo-Frodo (39). Shown are the 2FoFc (green cage) and FoFc (red cage) maps at the 1.0 and 4.0 σ levels, respectively. The residual FoFc density (red cage) located centrally in the biliverdin framework can be interpreted as Fe2+, which is not modeled in this structure. The axial His-20 is in 100% occupancy and is too far from the iron atom for a coordination bond. B, structure of the biliverdin vicinity for molecule A drawn with PyMOL (44). For His-20 and biliverdin, the carbon, nitrogen, and oxygen atoms are shown in light green, blue, and red, respectively. For iron-biliverdin, the carbon, nitrogen, oxygen, and iron atoms are shown in yellow, blue, red, and gray, respectively. Water molecules are shown in cyan. A water molecule with 30% occupancy is labeled as W with an arrow.
FIGURE 8.
FIGURE 8.
Proposed mechanism of the heme binding. A, proposed mechanism of heme binding to HmuO. B, stereo diagram of the boundary region of the proximal helix and new loop in the substrate-free HmuO. C, same region of the ferric-heme-HmuO complex. These figures were prepared with BOBSCRIPT (42) and Raster3D (43).
FIGURE 9.
FIGURE 9.
Schematic representation of the iron release from the Fe3+-biliverdin complex. State 1, the Fe3+-biliverdin complex. State 2, the structure of a minor component where iron is presumably reduced and the proximal His assumes the same conformation as that in the biliverdin complex. State 3, the structure of the major component where iron is removed from the biliverdin framework but W0 is not yet incorporated in the heme pocket. State 4, the biliverdin-HmuO complex. A mixture of two intermediates shown in states 2 and 3 represents the structure of molecules A and C from dataset IV (Fig. 7). This figure was prepared with Turbo-Frodo (39).

References

    1. Maines M. D. (1997) The heme oxygenase system: a regulator of second messenger gases. Annu. Rev. Pharmacol. Toxicol. 37, 517–554 - PubMed
    1. Schacter B. A., Nelson E. B., Marver H. S., Masters B. S. (1972) Immunochemical evidence for an association of heme oxygenase with the microsomal electron transport system. J. Biol. Chem. 247, 3601–3607 - PubMed
    1. Poss K. D., Tonegawa S. (1997) Heme oxygenase 1 is required for mammalian iron reutilization. Proc. Natl. Acad. Sci. U.S.A. 94, 10919–10924 - PMC - PubMed
    1. Boehning D., Snyder S. H. (2003) Novel neural modulators. Annu. Rev. Neurosci. 26, 105–131 - PubMed
    1. Paul B. D., Snyder S. H. (2012) H2S signaling through protein sulfhydration and beyond. Nat. Rev. Mol. Cell Biol. 13, 499–507 - PubMed

Publication types

MeSH terms

LinkOut - more resources