

Quality of life after TIA and stroke: ten-year results of the Oxford Vascular Study
- PMID: 24107865
- PMCID: PMC3806919
- DOI: 10.1212/WNL.0b013e3182a9f45f
Quality of life after TIA and stroke: ten-year results of the Oxford Vascular Study
Abstract
Objective: To evaluate the 5-year impact of stroke and TIA on utility and quality-adjusted survival.
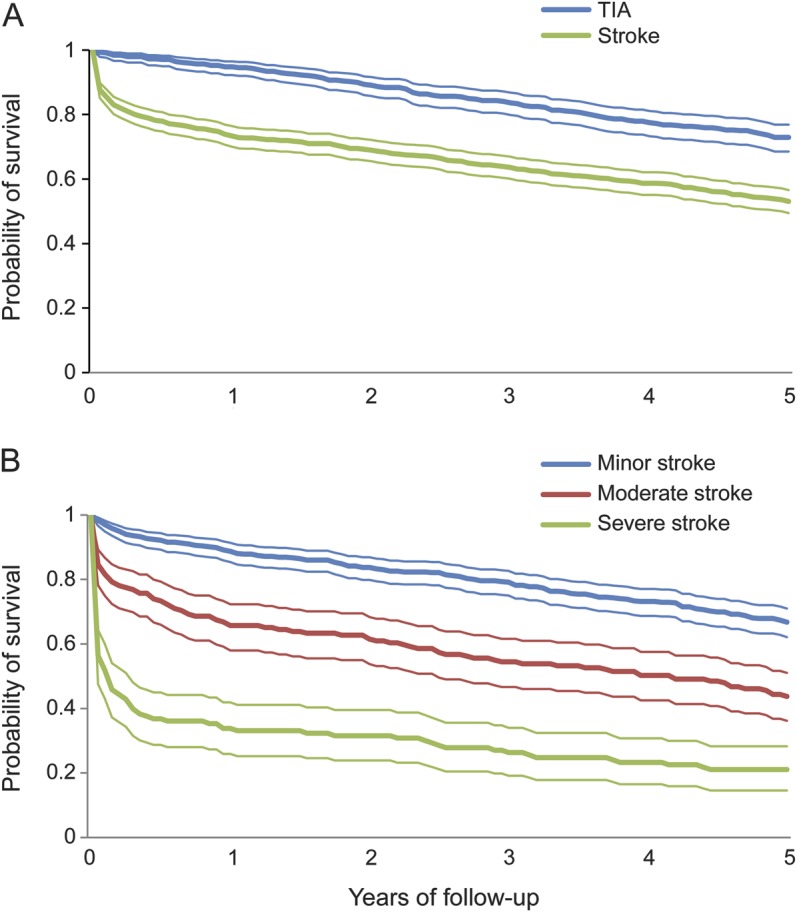
Methods: TIA and stroke patients from a UK population-based study (Oxford Vascular Study) were recruited from 2002 to 2007, and followed up until 2012. Quality of life was assessed over 5 years using the EQ-5D (EuroQol-5 Dimensions), with responses converted into utilities ranging from -0.59 (worse than death) to 1 (perfect health), using UK population valuations. Utilities for stroke and TIA patients were compared with those in matched controls obtained from the 2006 Health Survey for England. Five-year quality-adjusted life years were estimated by combining utility and survival information.
Results: Four hundred forty TIA and 748 stroke patients were ascertained and included. Utility remained constant at approximately 0.78 over the 5 years after TIA. Utility improved from 0.64 one month after stroke to 0.70 at 6 months (p = 0.006), remaining at approximately 0.70 thereafter. Matched controls had considerably higher utility levels than stroke/TIA patients (0.85, p < 0.001). Event severity and recurrent stroke were significant predictors of decreased long-term utility. Five-year quality-adjusted life expectancy was 3.32 (95% confidence interval: 3.22-3.48) quality-adjusted life years after TIA and 2.21 (2.15-2.37) after stroke, varying considerably by severity (minor: 2.94; moderate: 1.65; and severe: 0.70).
Conclusion: Quality-adjusted survival is low over the 5 years after stroke and TIA, with severity and recurrent stroke being major predictors. There remains considerable scope for improvements in acute treatment and secondary prevention to improve the quality of life after TIA and stroke.
Figures
References
-
- Stroke prevention by the practitioner: epidemiology of stroke. Cerebrovasc Dis 1999;9(suppl 4):1–68 - PubMed
-
- Jenkinson C, Gibbons E, Fitzpatrick R. A structured review of patient-reported outcome measures (PROMs) for stroke: report to the Department of Health [online]. Available at: http://phi.uhce.ox.ac.uk/pdf/PROMs_Oxford_Stroke_17092010.pdf. Accessed June 4, 2013
-
- Torrance GW, Feeny D. Utilities and quality-adjusted life years. Int J Technol Assess Health Care 1989;5:559–575 - PubMed
-
- National Institute for Health and Care Excellence Guides to the methods of technology appraisal [online]. Available at: http://publications.nice.org.uk/pmg9. Accessed June 4, 2013 - PubMed
-
- Feigin VL, Hoorn SV. How to study stroke incidence. Lancet 2004;363:1920. - PubMed
Publication types
MeSH terms
Grants and funding
LinkOut - more resources
Full Text Sources
Other Literature Sources
Medical