. 2014 Mar;8(3):493-503.
doi: 10.1038/ismej.2013.167. Epub 2013 Oct 10.

Gene-targeted metagenomic analysis of glucan-branching enzyme gene profiles among human and animal fecal microbiota

Affiliations

Gene-targeted metagenomic analysis of glucan-branching enzyme gene profiles among human and animal fecal microbiota

Sunghee Lee et al. ISME J. 2014 Mar.

Abstract

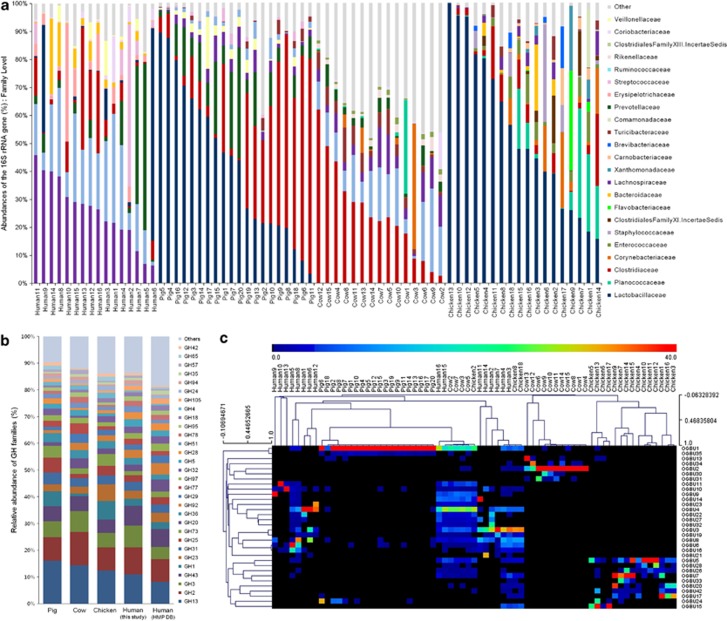
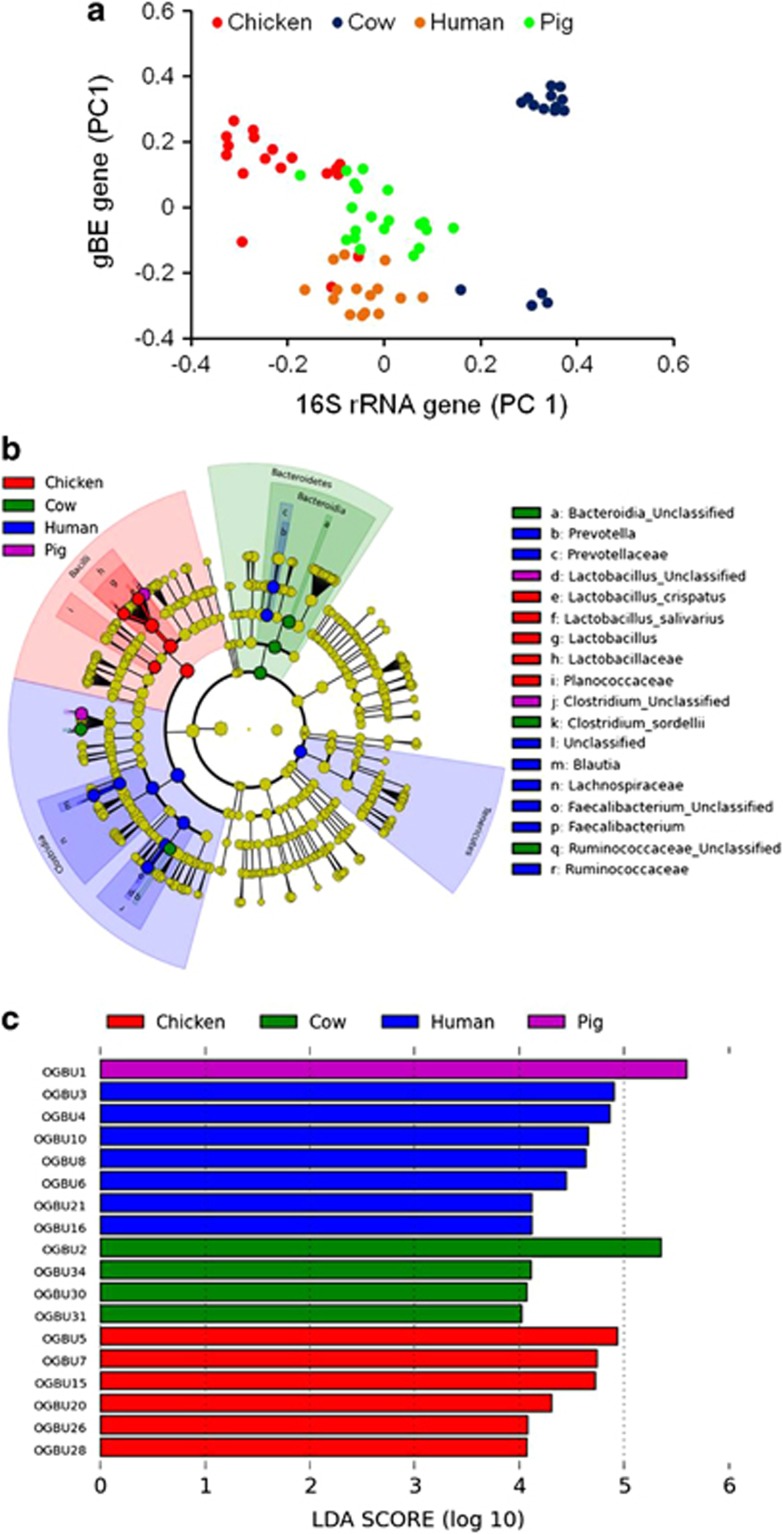
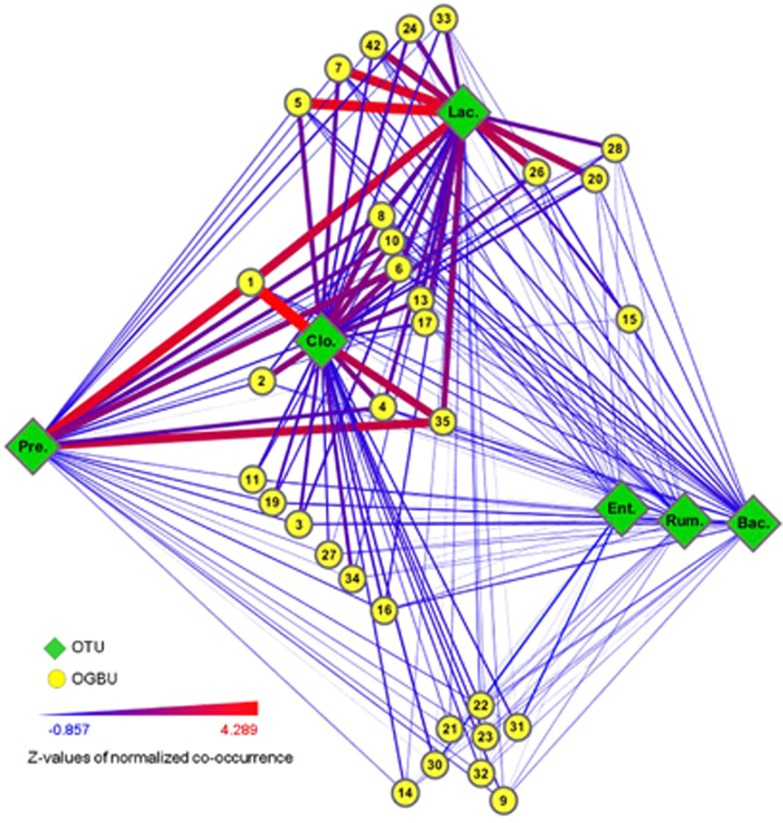
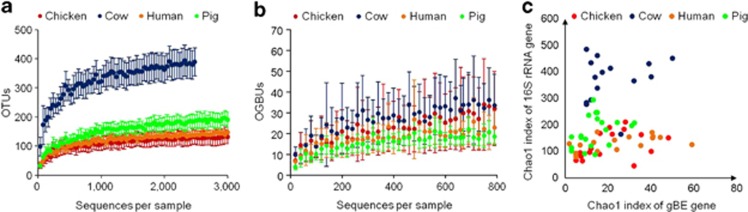
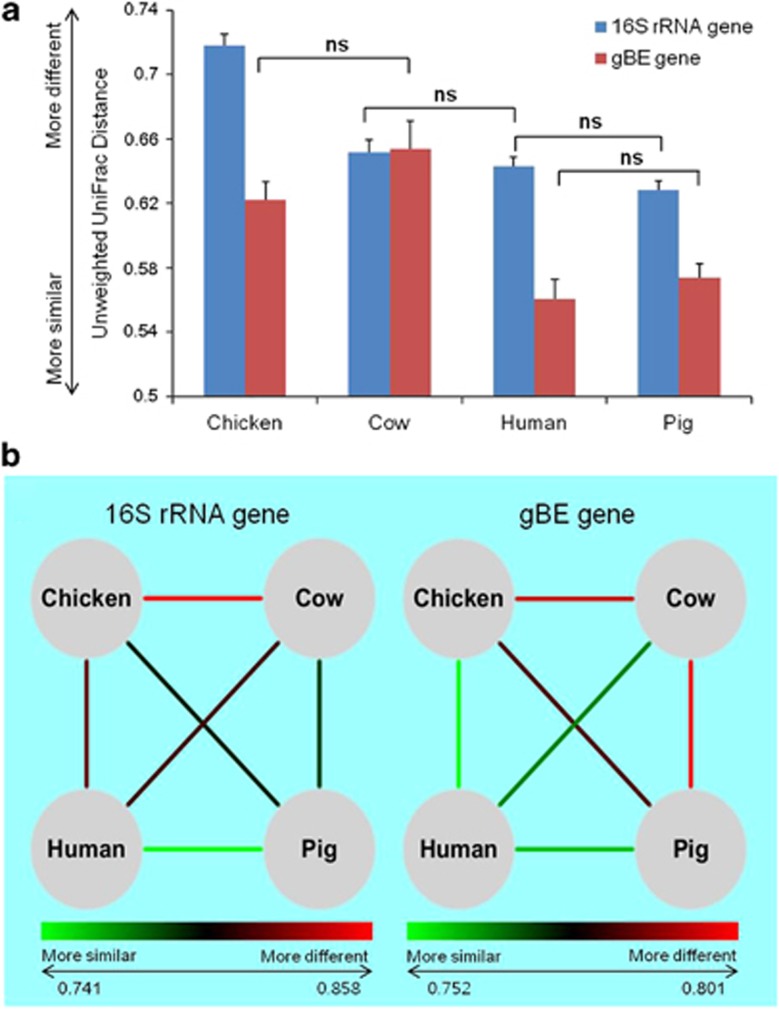
Glycoside hydrolases (GHs), the enzymes that breakdown complex carbohydrates, are a highly diversified class of key enzymes associated with the gut microbiota and its metabolic functions. To learn more about the diversity of GHs and their potential role in a variety of gut microbiomes, we used a combination of 16S, metagenomic and targeted amplicon sequencing data to study one of these enzyme families in detail. Specifically, we employed a functional gene-targeted metagenomic approach to the 1-4-α-glucan-branching enzyme (gBE) gene in the gut microbiomes of four host species (human, chicken, cow and pig). The characteristics of operational taxonomic units (OTUs) and operational glucan-branching units (OGBUs) were distinctive in each of hosts. Human and pig were most similar in OTUs profiles while maintaining distinct OGBU profiles. Interestingly, the phylogenetic profiles identified from 16S and gBE gene sequences differed, suggesting the presence of different gBE genes in the same OTU across different vertebrate hosts. Our data suggest that gene-targeted metagenomic analysis is useful for an in-depth understanding of the diversity of a particular gene of interest. Specific carbohydrate metabolic genes appear to be carried by distinct OTUs in different individual hosts and among different vertebrate species' microbiomes, the characteristics of which differ according to host genetic background and/or diet.


Figures

Figure 1
Figure 1
The relative abundance and relationship of bacteria and glycoside hydrolases genes in the gut microbiota from four different hosts. (a) The stacked bar graph shows the relative abundance of bacteria at the family level. (b) Relative abundances of glycoside hydrolases genes in the gut microbiota from four different hosts and 742 HMP database using whole genome shotgun sequencing of fecal samples. Each CAZy GH and PL is normalized by the relative abundance of two housekeeping genes (GT51 and GT28). (c) The heatmap shows relationship between hosts and OGBU genes, and color indicates abundance of the OGBU gene within hosts.
Figure 2
Figure 2
Concordances of 16S rRNA and gBE genes and abundance characteristics of OTUs and OGBUs in four different hosts. (a) Concordances of 16S rRNA and gBE genes using values of principal component 1 (PC1), and PC1 of 16S rRNA and gBE gene indicate 11.7% and 16.3%, respectively. (b) Cladogram of relevant features of 16S rRNA genes in four different hosts. (c) LDA (linear discriminant analysis) plot means biomarkers found by ranking accordingly to their effect size (4.0) of the OGBUs.
Figure 3
Figure 3
Associations between OGBUs and six major gut microbiota. Nodes, green diamond and yellow circles, indicate OTUs and OGBUs, respectively. Edge colors indicate increasing co-occurrence from thin blue to thick red. Each network of Bacteroides spp., Clostridium spp. from Clostridiaceae family, Lactobacillus spp., Prevotella spp., Enterococcus spp. and Ruminococcus spp. is presented in Supplementary Figure S4.
Figure 4
Figure 4
Alpha diversities of OTUs and gBE genes in four different hosts. (a) Phylogenetic diversity was estimated from the average Chao1 values of gut microbiota samples from chicken (red), cow (blue), human (orange) and pig (green). The results are based on 3000 sequences of 16S rRNA genes per sample. (b) The gBE genes per sample are based on 800 sequences. Bars indicate means±95% confidence intervals. (c) The scatter plot means concordance of alpha diversity between 16S rRNA and gBE genes.
Figure 5
Figure 5
Average unweighted UniFrac distances within (a) and between (b) chicken, cow, human and pig estimated from 16S rRNA and gBE gene PCR amplicon sequences. (a) The ns indicates nonsignificant differences between hosts, and the all other comparisons except ns are statistically significant (P<0.05). (b) Hosts (nodes) connected by normalized average unweighted UniFrac distance. Edge colors indicate increasing similarity from red to green. Similarity of 16S rRNA are in 0.741 (human–pig) to 0.858 (chicken–cow), and gBE are in 0.752 (chicken–human) to 0.801 (cow–pig) distance range.

References

    1. Balzer S, Malde K, Lanzén A, Sharma A, Jonassen I. Characteristics of 454 pyrosequencing data—enabling realistic simulation with flowsim. Bioinformatics. 2010;26:i420–i425. - PMC - PubMed
    1. Barbosa TM, Serra CR, La Ragione RM, Woodward MJ, Henriques AO. Screening for Bacillus isolates in the broiler gastrointestinal tract. Appl Environ Microbiol. 2005;71:968–978. - PMC - PubMed
    1. Brulc JM, Antonopoulos DA, Berg Miller ME, Wilson MK, Yannarell AC, Dinsdale EA, et al. Gene-centric metagenomics of the fiber-adherent bovine rumen microbiome reveals forage specific glycoside hydrolases. Proc Natl Acad Sci USA. 2009;106:1948–1953. - PMC - PubMed
    1. Callaway T, Dowd S, Edrington T, Anderson R, Krueger N, Bauer N, et al. Evaluation of bacterial diversity in the rumen and feces of cattle fed different levels of dried distillers grains plus solubles using bacterial tag-encoded FLX amplicon pyrosequencing. J Anim Sci. 2010;88:3977–3983. - PubMed
    1. Cantarel BL, Coutinho PM, Rancurel C, Bernard T, Lombard V, Henrissat B. The Carbohydrate-Active EnZymes database (CAZy): an expert resource for glycogenomics. Nucleic Acids Res. 2009;37:D233–D238. - PMC - PubMed

Publication types

Substances