. 2013 Oct 4:7:623.
doi: 10.3389/fnhum.2013.00623. eCollection 2013.

Physiological noise in brainstem FMRI

Affiliations

Physiological noise in brainstem FMRI

Jonathan C W Brooks et al. Front Hum Neurosci. .

Abstract

The brainstem is directly involved in controlling blood pressure, respiration, sleep/wake cycles, pain modulation, motor, and cardiac output. As such it is of significant basic science and clinical interest. However, the brainstem's location close to major arteries and adjacent pulsatile cerebrospinal fluid filled spaces, means that it is difficult to reliably record functional magnetic resonance imaging (fMRI) data from. These physiological sources of noise generate time varying signals in fMRI data, which if left uncorrected can obscure signals of interest. In this Methods Article we will provide a practical introduction to the techniques used to correct for the presence of physiological noise in time series fMRI data. Techniques based on independent measurement of the cardiac and respiratory cycles, such as retrospective image correction (RETROICOR, Glover et al., 2000), will be described and their application and limitations discussed. The impact of a physiological noise model, implemented in the framework of the general linear model, on resting fMRI data acquired at 3 and 7 T is presented. Data driven approaches based such as independent component analysis (ICA) are described. MR acquisition strategies that attempt to either minimize the influence of physiological fluctuations on recorded fMRI data, or provide additional information to correct for their presence, will be mentioned. General advice on modeling noise sources, and its effect on statistical inference via loss of degrees of freedom, and non-orthogonality of regressors, is given. Lastly, different strategies for assessing the benefit of different approaches to physiological noise modeling are presented.

Keywords: 7 T; brainstem; fMRI; imaging; physiological noise.


Figures

Figure 1
Figure 1
Temporal signal to noise (tSNR) map created from motion-corrected resting BOLD time series image data. tSNR is dramatically reduced in the brainstem when compared to other brain areas. Data were acquired from a single subject at 3 T using a 32-channel head coil, with 3 mm isotropic resolution, 100 time points, TE/TR = 30/3000 ms, flip angle = 90°, and acceleration factor 2.
Figure 2
Figure 2
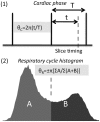
Calculation of cardiac and respiratory phase for RETROICOR. (1) Calculation of cardiac phase begins by identifying consistent features from the cardiac trace, e.g., peak in the pulse-oximeter waveform, R-wave in the electrocardiogram (ECG). The timing of slice acquisition relative to these features (vertical lines above) determines the cardiac phase, varying from 0 to 2π. (2) Respiratory phase needs to be calculated differently (see Glover et al., 2000), as both the timing and depth of breathing need to be accounted for, and inspiratory phase distinguished from expiratory phase using a sign change (i.e., phase range is −π to +π).
Figure 3
Figure 3
Representative improvements in temporal signal to noise (tSNR) obtained through modeling physiological noise (single subject data). On the left the absolute tSNR maps for each acquisition are provided for both pre- (“raw”) and post-correction (“corrected”), and the corresponding average tSNR within a brainstem mask is given in brackets. Voxels overlapping with the CSF filled spaces around the brainstem benefit most from physiological noise correction. Maps on the right demonstrate the ratio of the corrected to raw tSNR, and are thresholded at 1.1 to indicate where one might reasonably expect to see improvement of greater than 10% in the measured tSNR. Clearly the cortex appears to benefit most from this correction with increases in tSNR of 100% frequently observed at all resolutions and field strengths. The improvement in the brainstem is more modest, but nonetheless improved on average by at least 12.5% in this area (for all acquisitions).
Figure 4
Figure 4
Spatial localization of brainstem signal variation measured in 12 subjects (adapted from Harvey et al., 2008). Top row (A) left depicts a midline sagittal slice through the MNI standard brain with the approximate subdivisions of the brainstem indicated (Med, medulla; Mes, mesencephalon; PAG, periaqueductal gray matter). Middle: the mean CV over the group of subjects studied is superimposed to show regions of high signal variability. Highest signal variation was observed in the mesencephalon and near the surface of the pons and medulla. The improvement following application of the modified RETROICOR (3C4R1X) model is demonstrated in the right-most image, which shows the percentage reduction in temporal standard deviation when compared to baseline (no correction). Significant reduction in signal variance was found in and around the PAG and the edges of the pons and medulla. The lower portion of the figure (B) shows histograms of the temporal coefficient of variation for both the uncorrected (red) and corrected (green) resting data in the three brainstem regions examined. Voxel counts were normalized to the total number of voxels in each region. Also shown for each region is the histogram of percentage reduction in temporal standard deviation (blue), and demonstrates that the largest benefit of physiological noise modeling occurred in the medulla, where the proportion of voxels with a reduction in SD greater than 10% is largest, although clearly modeling was beneficial in pons and mesencephalon also. (Reproduced from Harvey et al., 2008).

References

    1. Aja-Fernández S., Tristán-Vega A., Hoge W. S. (2011). Statistical noise analysis in GRAPPA using a parametrized noncentral Chi approximation model. Magn. Reson. Med. 65, 1195–120610.1002/mrm.22701 - DOI - PMC - PubMed
    1. Beckmann C. F., Smith S. M. (2004). Probabilistic independent component analysis for functional magnetic resonance imaging. IEEE Trans. Med. Imaging 23, 137–15210.1109/TMI.2003.822821 - DOI - PubMed
    1. Beissner F., Baudrexel S., Volz S., Deichmann R. (2010). Dual-echo EPI for non-equilibrium fMRI – implications of different echo combinations and masking procedures. Neuroimage 52, 524–53110.1016/j.neuroimage.2010.04.243 - DOI - PubMed
    1. Beissner F., Deichmann R., Baudrexel S. (2011). fMRI of the brainstem using dual-echo EPI. Neuroimage 55, 1593–159910.1016/j.neuroimage.2011.01.042 - DOI - PubMed
    1. Birn R. M., Diamond J. B., Smith M. A., Bandettini P. A. (2006). Separating respiratory-variation-related fluctuations from neuronal-activity-related fluctuations in fMRI. Neuroimage 31, 1536–154810.1016/j.neuroimage.2006.02.048 - DOI - PubMed