. 2013 Dec;24(23):3634-50.
doi: 10.1091/mbc.E13-05-0264. Epub 2013 Oct 9.

Identification of cell cycle-regulated genes periodically expressed in U2OS cells and their regulation by FOXM1 and E2F transcription factors

Affiliations

Identification of cell cycle-regulated genes periodically expressed in U2OS cells and their regulation by FOXM1 and E2F transcription factors

Gavin D Grant et al. Mol Biol Cell. 2013 Dec.

Abstract

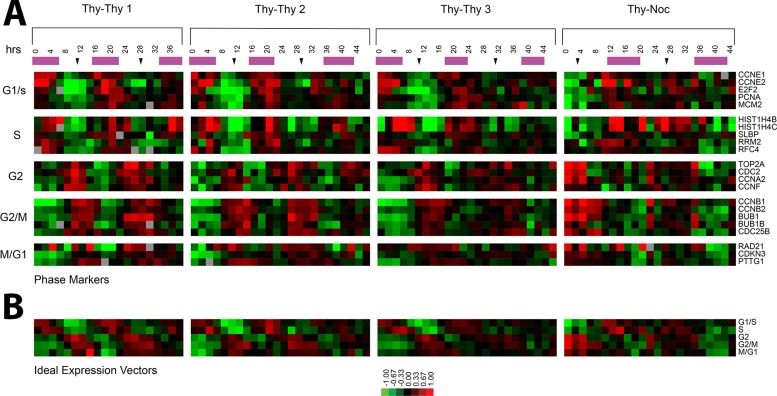
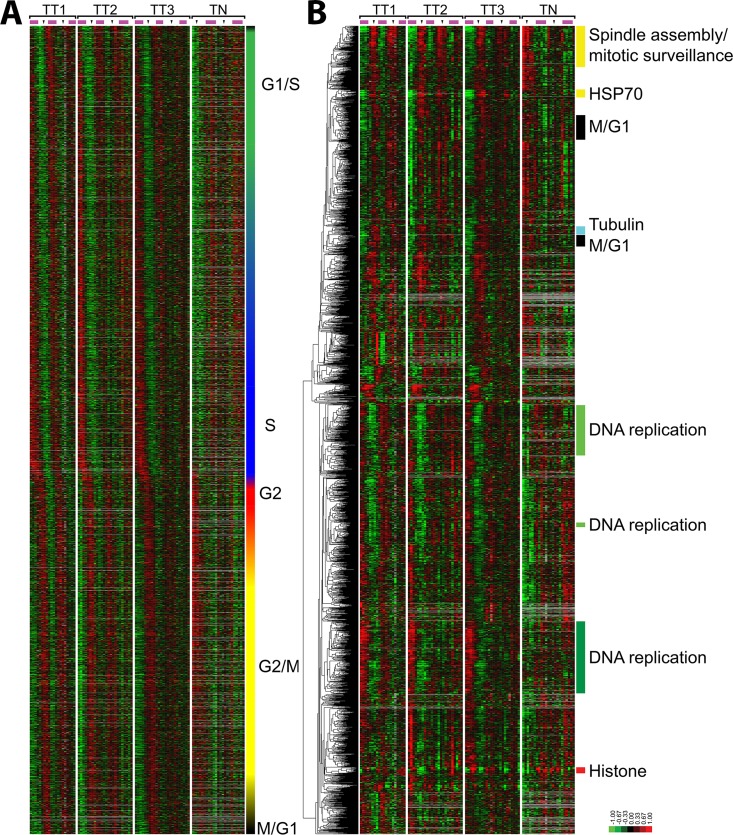
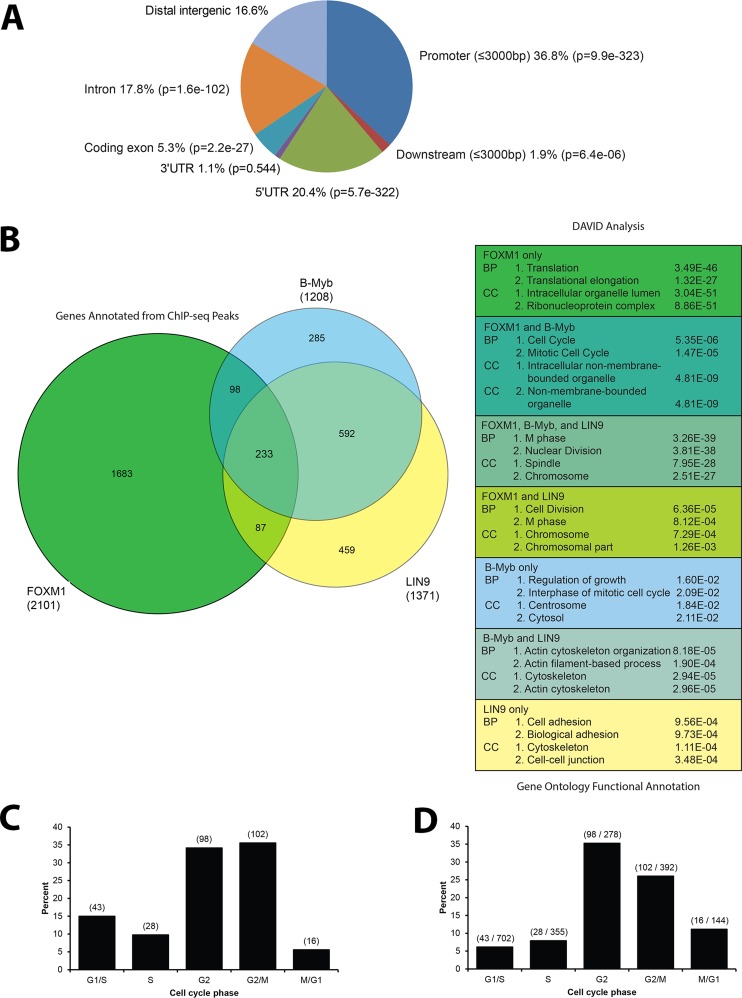
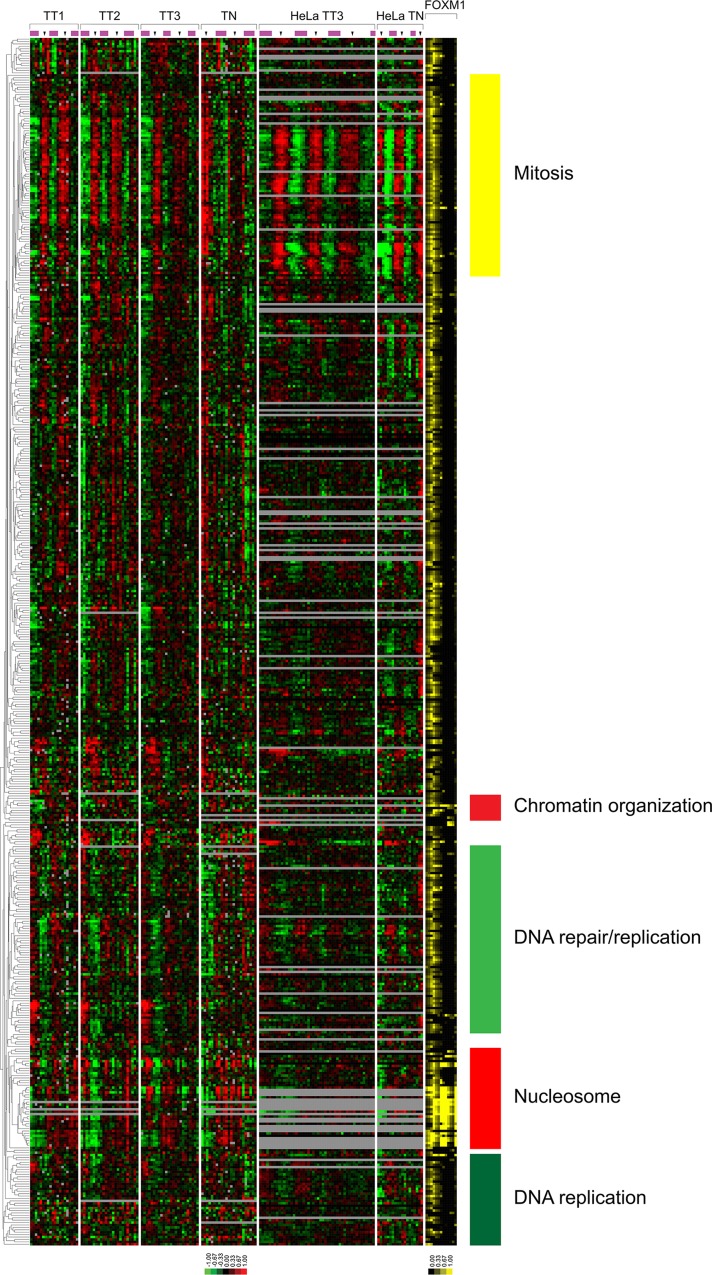
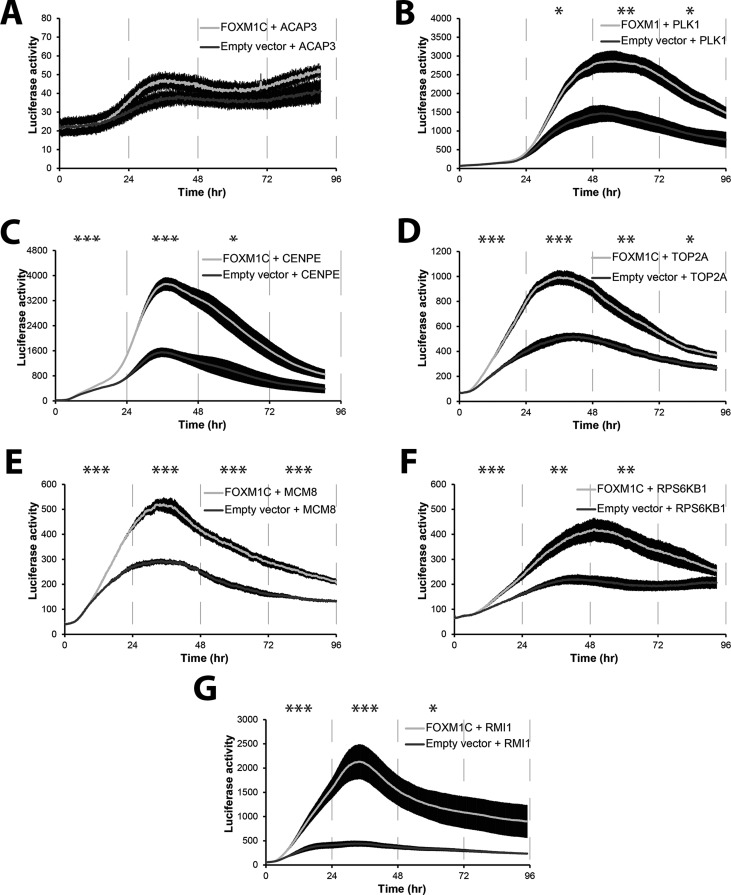
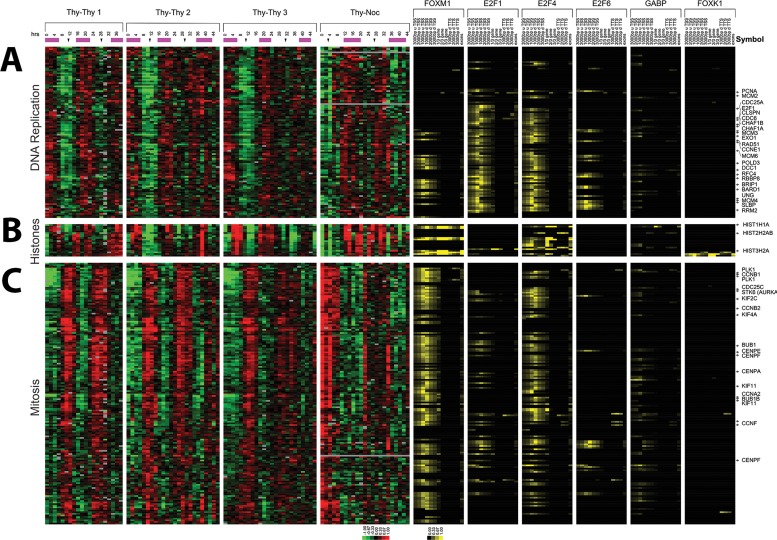
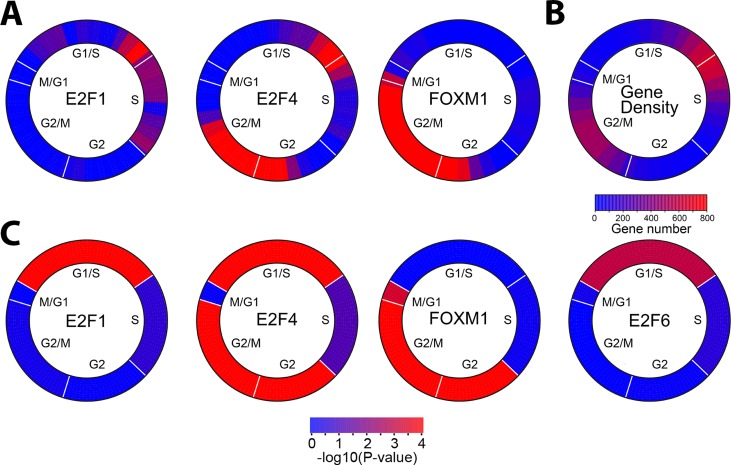
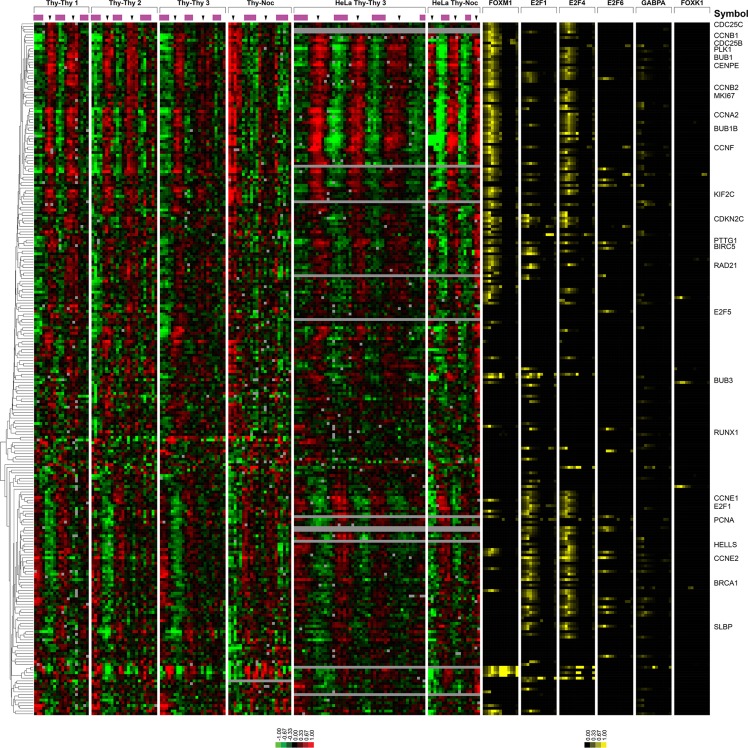
We identify the cell cycle-regulated mRNA transcripts genome-wide in the osteosarcoma-derived U2OS cell line. This results in 2140 transcripts mapping to 1871 unique cell cycle-regulated genes that show periodic oscillations across multiple synchronous cell cycles. We identify genomic loci bound by the G2/M transcription factor FOXM1 by chromatin immunoprecipitation followed by high-throughput sequencing (ChIP-seq) and associate these with cell cycle-regulated genes. FOXM1 is bound to cell cycle-regulated genes with peak expression in both S phase and G2/M phases. We show that ChIP-seq genomic loci are responsive to FOXM1 using a real-time luciferase assay in live cells, showing that FOXM1 strongly activates promoters of G2/M phase genes and weakly activates those induced in S phase. Analysis of ChIP-seq data from a panel of cell cycle transcription factors (E2F1, E2F4, E2F6, and GABPA) from the Encyclopedia of DNA Elements and ChIP-seq data for the DREAM complex finds that a set of core cell cycle genes regulated in both U2OS and HeLa cells are bound by multiple cell cycle transcription factors. These data identify the cell cycle-regulated genes in a second cancer-derived cell line and provide a comprehensive picture of the transcriptional regulatory systems controlling periodic gene expression in the human cell division cycle.


Figures

FIGURE 1:
FIGURE 1:
Periodic expression of well-characterized cell cycle genes. (A) Expression profiles of known periodically expressed genes for each of the four time courses. The purple bars indicate S phase, and black arrows indicate mitosis as estimated by flow cytometry or Western blots. (B) The idealized vector for each phase is the average expression of the known genes shown in A.
FIGURE 2:
FIGURE 2:
Periodically expressed genes in the U2OS cell cycle. (A) The 2830 probes that show periodic expression in U2OS cells, ordered by the point of their peak expression as calculated from their sine and cosine values in the Fourier transform. Phase assignments were performed using the correlation coefficients with the ideal vectors defined in Figure 1. The color bar on the right indicates the phase of peak expression (G1/S, green; S, blue; G2, red; G2/M, yellow; and M/G1, black); blended colors indicate interspersed phase assignments. (B) The 2830 periodically expressed probes from U2OS cells were ordered by average linkage hierarchical clustering. The enriched biological processes of select clusters is indicated.
FIGURE 3:
FIGURE 3:
FOXM1 ChIP-seq indicates a role for FOXM1 in the cell cycle and translation. (A) CEAS analysis of the overlapping FOXM1 ChIP-seq analysis shows enrichment in promoters, downstream regions, 5′UTRs, and coding exons relative to background. (B) Venn diagram showing the overlapping gene targets of FOXM1, B-Myb, and LIN9 (b-Myb and LIN9 results from Sadasivam et al., 2012). There is enrichment in cell cycle Gene Ontology (GO) terms for biological process (BP) and cellular component (CC) in the overlapping gene lists for FOXM1/B-Myb, FOXM1/B-Myb/LIN9, and FOXM1/LIN9. FOXM1 genes that do not overlap with B-Myb or LIN9 show an enrichment in the GO term translation. (C) Bar graph showing the percentage of FOXM1 targets per cell cycle phase. (D) Bar graph showing the percentage of genes in each phase that are bound by FOXM1.
FIGURE 4:
FIGURE 4:
The expression profiles of genes bound by FOXM1. The clustered U2OS and HeLa cell expression profiles of the 501 genes bound by FOXM1 that are cell cycle regulated in U2OS cells. FOXM1 transcription factor binding is shown as percentage coverage of the UCSC genome browser gene model as defined by GCA for each gene (see Supplemental Figure S6 for more detail).
FIGURE 5:
FIGURE 5:
FOXM1 overexpression activates the expression of a number of target genes found via ChIP-seq. (A) Neither FOXM1 (light line) nor the empty vector control (dark line) activates the ACAP3 promoter. ACAP3 is a known FOXK1 target (Grant et al., 2012) and is used as a negative control. (B–D) FOXM1 activates the promoters of PLK1, CENPE, and TOP2A, known FOXM1 targets (Figure 4 and Supplemental Figure S6). (E) FOXM1 activates the MCM8 promoter. (F) FOXM1 activates the promoter of RPS6KB1, which phosphorylates the 6S ribosomal protein. (G) The previously unknown FOXM1 target RMI1 promoter is activated by FOXM1 overexpression. Error bars, SEM. Time points were binned and averaged for every 24 h for a one-way analysis of variance. *p ≤ 0.05; **p ≤ 0.01, ***p ≤ 0.005.
FIGURE 6:
FIGURE 6:
Biological process–specific gene clusters have coordinated transcription factor binding. (A) After the inclusion of FOXM1 ChIP-seq data as well as ENCODE data, hierarchical clustering shows that the genes in the U2OS S phase cluster are predominantly bound by E2F1 and E2F4. (B) The histone cluster shows E2F4 bound to more gene models than E2F1 or FOXM1. (C) Genes in the mitosis gene cluster are primarily bound by FOXM1 or E2F4. Transcription factor binding is shown as percentage of coverage of each portion of the gene model as defined by GCA (see Supplemental Figure S6 for more details).
FIGURE 7:
FIGURE 7:
Transcription factor binding as a function of cell cycle phase. (A) Enrichment of transcription factor targets using a sliding window across the cell cycle indicates enrichment of E2F1, E2F4, and FOXM1 binding to genes that show peak expression at specific times during the cell cycle. Phase angles were calculated from the arc tangent of the Fourier analysis. Transcription factor binding enrichment was calculated using Fischer's exact test over a sliding window of 30° with a 10° overlap between neighboring windows. Cell cycle phase is indicated (B) Gene density in each sliding window was calculated for the expression of all the cell cycle–regulated genes in U2OS cells. (C) Enrichment of transcription factor targets in each cell cycle phase was calculated using estimated phase boundaries rather than a sliding window. The significance of transcription factor binding enrichment was calculated using Fischer's exact test. Transcription factor binding data were from HeLa cells, except for E2F6, which was from K562 cells. The p values for each transcription factor at each phase are given in Table 2.
FIGURE 8:
FIGURE 8:
Core cell cycle–regulated genes between HeLa cells and U2OS cells are bound by FOXM1 or E2F1. The 253 genes that show periodic regulation in both HeLa cells and U2OS cells have been clustered after the inclusion of the FOXM1 and FOXK1 ChIP-seq data and the ENCODE data for selected transcription factors. Transcription factor binding is shown as percentage of coverage of each portion of the gene model as defined by GCA (see Supplemental Figure S6 for more details).

References

    1. Ahmad A, Ali S, Wang Z, Ali AS, Sethi S, Sakr WA, Raz A, Rahman KM. 3,3’-Diindolylmethane enhances taxotere-induced growth inhibition of breast cancer cells through downregulation of FoxM1. Int J Cancer. 2011;129:1781–1791. - PMC - PubMed
    1. Ahmad A, Wang Z, Kong D, Ali S, Li Y, Banerjee S, Ali R, Sarkar FH. FoxM1 down-regulation leads to inhibition of proliferation, migration and invasion of breast cancer cells through the modulation of extra-cellular matrix degrading factors. Breast Cancer Res Treat. 2010;122:337–346. - PubMed
    1. Ahmed M, et al. FoxM1 and its association with matrix metalloproteinases (MMP) signaling pathway in papillary thyroid carcinoma. J Clin Endocrinol Metab. 2012;97:E1–E13. - PubMed
    1. Alter O, Brown PO, Botstein D. Singular value decomposition for genome-wide expression data processing and modeling. Proc Natl Acad Sci USA. 2000;97:10101–10106. - PMC - PubMed
    1. Alvarez-Fernandez M, Halim VA, Krenning L, Aprelia M, Mohammed S, Heck AJ, Medema RH. Recovery from a DNA-damage-induced G2 arrest requires Cdk-dependent activation of FoxM1. EMBO Rep. 2010;11:452–458. - PMC - PubMed

Publication types