Benchmarking RNA-Seq quantification tools
- PMID: 24109770
- PMCID: PMC5003039
- DOI: 10.1109/EMBC.2013.6609583
Benchmarking RNA-Seq quantification tools
Abstract
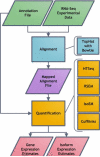
RNA-Seq, a deep sequencing technique, promises to be a potential successor to microarrays for studying the transcriptome. One of many aspects of transcriptomics that are of interest to researchers is gene expression estimation. With rapid development in RNA-Seq, there are numerous tools available to estimate gene expression, each producing different results. However, we do not know which of these tools produces the most accurate gene expression estimates. In this study we have addressed this issue using Cufflinks, IsoEM, HTSeq, and RSEM to quantify RNA-Seq expression profiles. Comparing results of these quantification tools, we observe that RNA-Seq relative expression estimates correlate with RT-qPCR measurements in the range of 0.85 to 0.89, with HTSeq exhibiting the highest correlation. But, in terms of root-mean-square deviation of RNA-Seq relative expression estimates from RT-qPCR measurements, we find HTSeq to produce the greatest deviation. Therefore, we conclude that, though Cufflinks, RSEM, and IsoEM might not correlate as well as HTSeq with RT-qPCR measurements, they may produce expression values with higher accuracy.
Figures


References
-
- Mortazavi A, Williams BA, McCue K, Schaeffer L, Wold B. Mapping and quantifying mammalian transcriptomes by RNA-Seq. Nature methods. 2008;5:621–628. - PubMed
Publication types
MeSH terms
Substances
Grants and funding
LinkOut - more resources
Full Text Sources
Other Literature Sources
