. 2013:2013:5550-3.
doi: 10.1109/EMBC.2013.6610807.

Modeling spatial population dynamics of stem cell lineage in wound healing and cancerogenesis

Modeling spatial population dynamics of stem cell lineage in wound healing and cancerogenesis

Youfang Cao et al. Annu Int Conf IEEE Eng Med Biol Soc. 2013.

Abstract

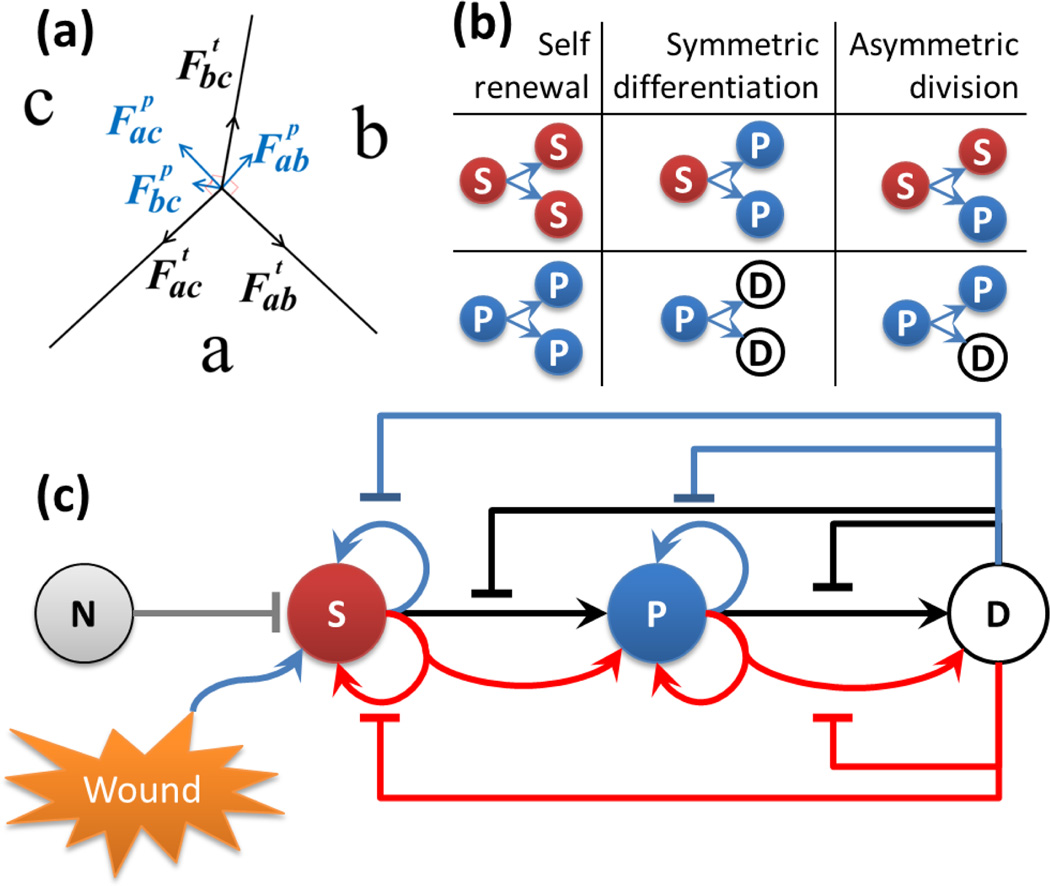
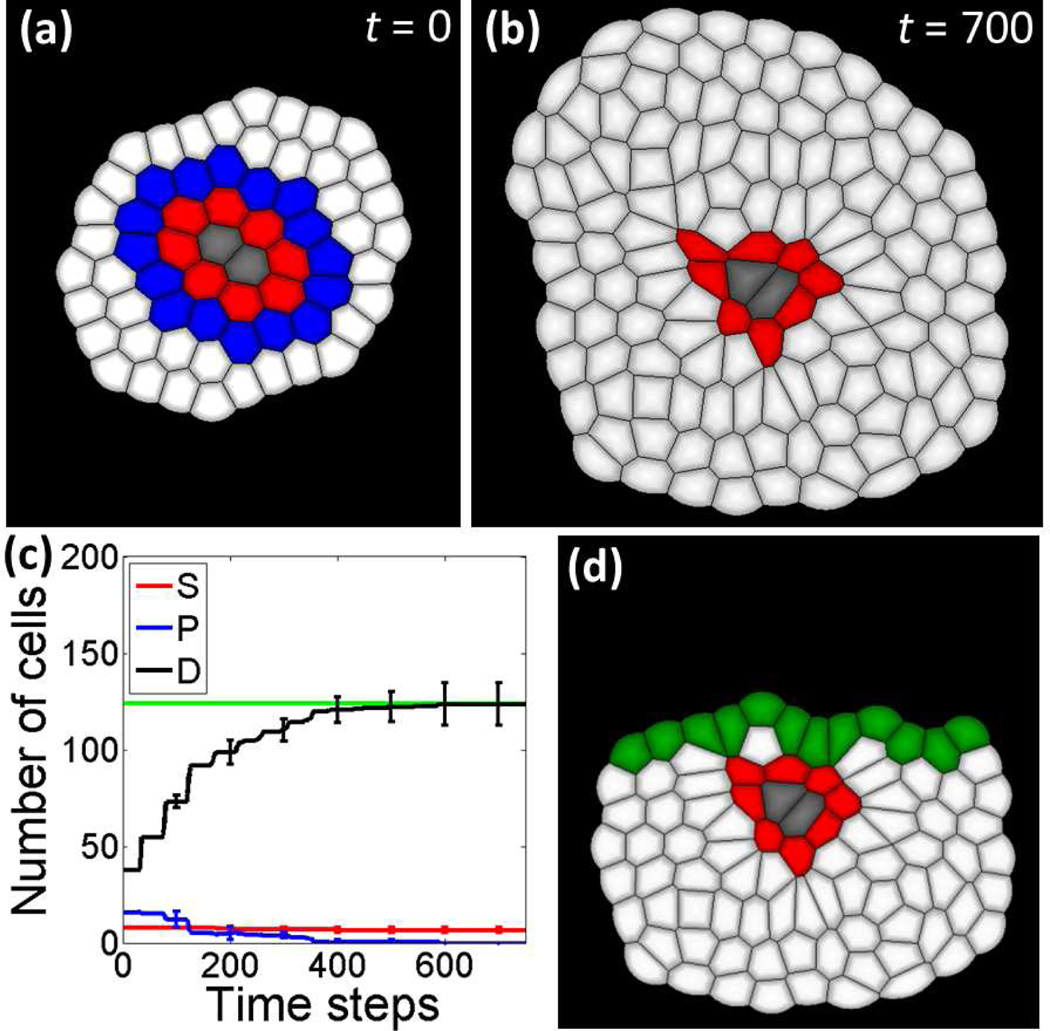
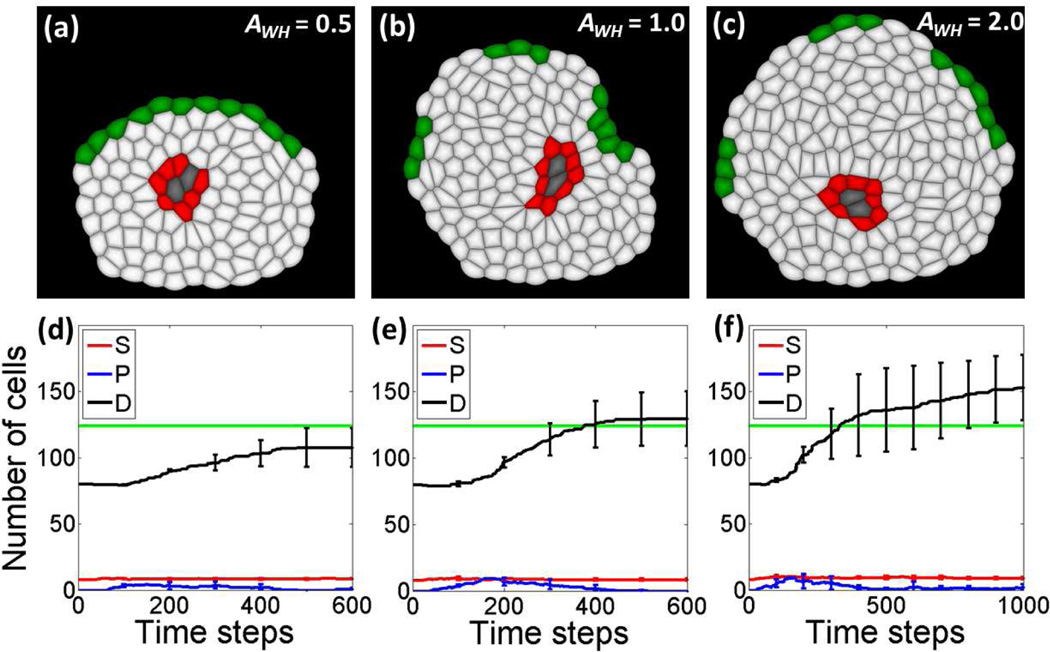
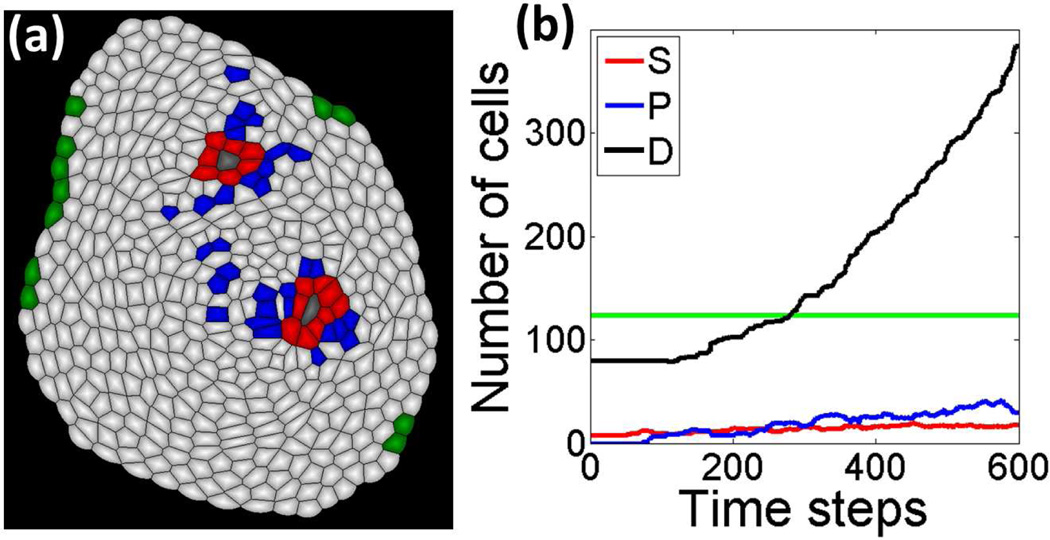
Modeling the dynamics of cell population in tissues involving stem cell niches allows insight into the control mechanisms of the important wound healing process. It is well known that growth and divisions of stem cells are mainly repressed by niche cells, but can also be activated by signals released from wound. In addition, the proliferation and differentiation among three different types of cell: stem cells (SCs), intermediate progenitor cells (IPCs), and fully differentiated cells (FDCs) in stem cell lineage are under different activation and inhibition controls. We have developed a novel stochastic spatial dynamic model of cells. We can characterize not only overall cell population dynamics, but also details of temporal-spatial relationship of individual cells within a tissue. In our model, the shape, growth, and division of each cell are modeled using a realistic geometric model. Furthermore, the inhibited growth rate, proliferation and differentiation probabilities of individual cells are modeled through feedback loops controlled by secreted factors and wound signals from neighboring cells. With specific proliferation and differentiation probabilities, the actual division type that each cell will take is chosen by a Monte Carlo sampling process. With simulations, we study the effects of different strengths of wound signals to wound healing behaviors. We also study the correlations between chronic wound and cancerogenesis.


Figures

Fig.1
Fig.1
Our model. (a) The forces at the junction vertex of three cells a, b and c in our cell growth model. Tension is tangential to the edge (black). Pressure is normal to the edge (blue). The net force on the junction vertex is obtained by summing tension and pressure acting on the vertex. (b) Division types of stem cells and progenitor cells. Red sphere labeled with (S) indicates stem cells, blue sphere (P) indicates progenitor cells, and white sphere (D) indicates differentiated cell. The same color code is used for illustration of resulting tissues. (c) Feedback controls of stem cell lineage. The gray (N) sphere indicates niche cells. Blue arrows indicate self-renewal or proliferation divisions. Black arrows indicate symmetric divisions. Red arrows indicate asymmetric divisions. Flat-head arrows extending from differentiated cell with corresponding colors indicate inhibitions to respective type of divisions.
Fig.2
Fig.2
Normal tissue and wound infliction. (a) Small starting cell group for simulations of the temporal-spatial dynamics model contains 64 cells. Niche cells are labeled in gray, stem cells are in red, progenitor cells are in blue, and differentiated cells are in white. (b) One example normal tissue achieved homeostatic size control. This steady state tissue contains 8 stem cells, 2 niche cells and 120 differentiated cells. (C) Dynamics of cell numbers during tissue development. The red curve shows the dynamics of stem cell numbers, the blue line is progenitor cells, and the black line is differentiated cells. Error bars show the standard deviations at 100, 200, 300, 400, 500, 600 and 700 time steps are calculated from four independent simulations, respectively. The average number of differentiated cells in the steady state is shown in the green straight line. (d) Wound infliction is created by cut the top part of the normal tissue in (b). Cells at the wound edge are shown in green.
Fig.3
Fig.3
Wound healing results with different strengths of wound signal AWH. (b) and (e) Normal wound healing results with AWH = 1.0. (a) and (d) Incomplete wound healing by a weak wound signal AWH = 0.5. (c) and (f) Stronger wound signal of AWH = 2.0 leads to an over-recovery, which may be related to abnormal wound healing like keloids.
Fig.4
Fig.4
Deregulated wound healing and cancerogenesis. (a) A snapshot of simulations in tissue with deregulated wound signals. (b) The dynamics of numbers of different types of cells.

References

    1. Arwert EN, Hoste E, Watt FM. Epithelial stem cells, wound healing and cancer. Nature Reviews Cancer. 2012;12(3):170–180. - PubMed
    1. Boehnke K, Falkowska-Hansen B, Stark HJ, Boukamp P. Stem cells of the human epidermis and their niche: composition and function in epidermal regeneration and carcinogenesis. Carcinogenesis. 2012;33(7):1247–1258. - PubMed
    1. Fuchs E, Tumbar T, Guasch G. Socializing with the neighbors: stem cells and their niche. Cell. 2004;116(6):769–778. - PubMed
    1. Wilson A, Laurenti E, et al. Hematopoietic stem cells reversibly switch from dormancy to self-renewal during homeostasis and repair. Cell. 2008;135(6):1118–1129. - PubMed
    1. Lander AD. Pattern, Growth, and Control. Cell. 2011 Mar 18;144:955–969. - PMC - PubMed

Publication types

LinkOut - more resources