. 2013 Oct 10;4(10):e839.
doi: 10.1038/cddis.2013.344.

ROS-dependent phosphorylation of Bax by wortmannin sensitizes melanoma cells for TRAIL-induced apoptosis

Affiliations

ROS-dependent phosphorylation of Bax by wortmannin sensitizes melanoma cells for TRAIL-induced apoptosis

S-A Quast et al. Cell Death Dis. .

Abstract

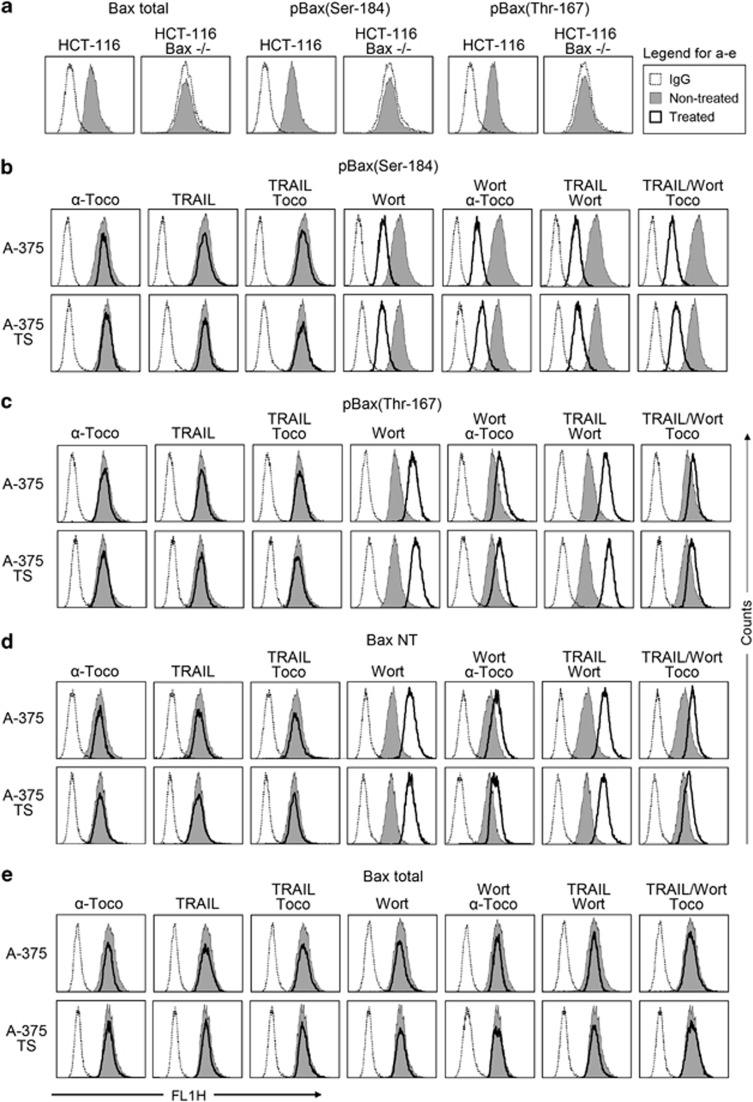
The pathways of reactive oxygen species (ROS)-mediated apoptosis induction, of Bax activation and the sensitization of tumor cells for TRAIL (TNF-related apoptosis-inducing ligand)-induced apoptosis are still largely elusive. Here, sensitization of melanoma cells for TRAIL by the PI3-kinase inhibitor wortmannin correlated to the activation of mitochondrial apoptosis pathways. Apoptosis was dependent on Bax and abrogated by Bcl-2 overexpression. The synergistic enhancement was explained by Bax activation through wortmannin, which tightly correlated to the characteristic Bax phosphorylation patterns. Thus, wortmannin resulted in early reduction of the Bax-inactivating phosphorylation at serine-184, whereas the Bax-activating phosphorylation at threonine-167 was enhanced. Proving the responsibility of the pathway, comparable effects were obtained with an Akt inhibitor (MK-2206); while suppressed phosphorylation of serine-184 may be attributed to reduced Akt activity itself, the causes of enhanced threonine-167 phosphorylation were addressed here. Characteristically, production of ROS was seen early in response to wortmannin and MK-2206. Providing the link between ROS and Bax, we show that abrogated ROS production by α-tocopherol or by NADPH oxidase 4 (NOX4) siRNA suppressed apoptosis and Bax activation. This correlated with reduced Bax phosphorylation at threonine-167. The data unraveled a mechanism by which NOX4-dependent ROS production controls apoptosis via Bax phosphorylation. The pathway may be considered for proapoptotic, anticancer strategies.


Figures

Figure 1
Figure 1
Sensitization of melanoma cells for TRAIL-induced apoptosis by wortmannin. (a) Apoptosis (percentage of sub-G1 cells) was determined by cell cycle analysis in A-375, A-375-TS and Mel-HO cells treated for 24 h with increasing concentrations of TRAIL (0–200 ng/ml). Cytotoxicity was determined in parallel by an LDH release assay. Means and SDs are shown of two independent experiments, each one consisting of triplicates. Statistical significance (*P<0.005) is indicated for the comparison of A-375 cells and TRAIL-resistant A-375-TS cells. (b) Time-dependent changes of phosphorylated Akt at serine-473 and at threonine-308 after treatment with 4 μM wortmannin are shown by western blotting in A-375 and A-375-TS. The signals of an antibody for total Akt are shown as controls. Equal protein loading (30 μg per lane) was proven by GAPDH. (c) Apoptosis in response to wortmannin (4 μM, 8 μM) +/− TRAIL (20 ng/ml) was monitored by cell cycle analysis in six melanoma cell lines (A-375, A-375-TS, Mel-HO, Mel-HO-TS, MeWo and Mel-2a). Cytotoxicity was determined in parallel by LDH release (in %). Statistical significance (*P<0.005) is indicated when comparing TRAIL-treated and wortmannin/TRAIL-treated cells. Insets: Histogram examples of cells treated with wortmannin/TRAIL (open graphs) as compared to DMSO controls (gray). Sub-G1 cell populations are indicated (sG1). (d) Real-time growth curves of A-375 and A-375-TS treated with wortmannin (4 μM) and/or TRAIL (20 ng/ml) were compared to DMSO controls. Cell indices were normalized at the time of treatment (24 h after seeding)
Figure 2
Figure 2
No enhanced caspase processing but ROS production by wortmannin/TRAIL. (a) Processing of caspase-8, -9, -3 and cleavage of Bid was monitored by western blotting in A-375 and A-375-TS in response to 8 h of treatment with wortmannin (4 μM) and/or TRAIL (20 ng/ml). Two independent experiments revealed highly comparable results. (b) Apoptosis (% of sub-G1 cells) is shown for A-375 and Mel-HO treated with TRAIL (20 ng/ml) and/or wortmannin (4 μM)+/− the pancaspase inhibitor Q-VD-OPh (10 μM, 1 h pretreatment). Cytotoxicity was determined in parallel by a LDH release assay (in %). (c) ROS levels (10 000 cells gated) were determined by H2DCFDA staining and flow cytometry in A-375 and A-375-TS at 1, 2, 4 and 8 h after treatment with 20 ng/ml TRAIL, 4 μM wortmannin and/or 200 μM α-tocopherol (1 h pretreatment). Treated cells (open graphs) were compared to DMSO controls (gray). Higher fluorescence corresponds to increased ROS levels. (d) Apoptotic rates (% of sub-G1 cells) were determined in A-375 and A-375-TS in response to TRAIL (20 ng/ml), wortmannin (4 μM) and/or α-tocopherol (200 μM, 1 h pretreatment)
Figure 3
Figure 3
Response of mitochondria and Bcl-2 proteins. (a) Decreased mitochondrial Δψm was determined by flow cytometry after TMRM+ staining in A-375 and A-375-TS. Cells were treated for 1–8 h with TRAIL (20 ng/ml), wortmannin (4 μM) and/or α-tocopherol (200 μM, 1 h pretreatment). Treated cells (open graphs) were compared to DMSO controls (gray). Three independent experiments (each with triplicate values) revealed comparable results. (b) Cytosolic extracts (Cyto) of A-375 and A-375-TS, treated for 2 h with wortmannin, TRAIL and/or α-tocopherol, were analyzed by western blotting for the release of cytochrome c, Smac and AIF. Equal protein amounts were loaded as proven by incubation with GAPDH. A mitochondrial extract (Mito) served as control. A western blot for VDAC (30 kDa) ruled out contaminations of cytosolic extracts with mitochondria. A protein band of 37 kDa seen for A-375 traces back to a previous incubation of the blot with GAPDH (c) Expression of Bcl-2 proteins was determined by western blotting in A-375 and A-375-TS in response to wortmannin (4 μM) and/or TRAIL. Some slight differences seen for some proteins were not reproducible in the second, independent experiment (data not shown)
Figure 4
Figure 4
Abrogation of wortmannin/TRAIL-induced apoptosis by exogeneous Bcl-2. (a) Apoptosis by wortmannin/TRAIL was investigated in A-375 cells stably transfected with Bcl-2 (A-375-Bcl-2) and mock-transfected controls (A-375-pIRES). Inset, Bcl-2 expression in both cell clones. (b) Sensitivity for TRAIL/wortmannin-induced apoptosis (20 ng/ml; 4 μM) was investigated in A-375 and Mel-HO after siRNA-mediated Bcl-2 knockdown. SiRNA treatment was compared to a siRNA mock control (Si-Ctrl). Apoptosis (% of sub-G1 cells) and cytotoxicity (% LDH release) are shown for 24 h treatment (mean values and SDs of two independent experiments, each with triplicates). Statistical significance is indicated for the response to wortmannin of si-Bcl-2-treated cells as compared to mock controls (*P<0.005). Insets: Knockdown of Bcl-2 is shown by western blotting. Equal protein loading (30 μg per lane) was proven by GAPDH. (c) Δψm in response to wortmannin (4 μM) and TRAIL (20 ng/ml) treatment (24 h) is shown for the mock (A-375-pIRES) and the Bcl-2-overexpressing clone (A-375-Bcl-2). Treated cells (open graphs) were compared to DMSO controls (gray). (d) ROS levels were determined by H2DCFDA staining and flow cytometry in A-375-Bcl-2 and A-375-pIRES at 24 h of treatment with 20 ng/ml TRAIL, 4 μM wortmannin and/or α-tocopherol (200 μM, 1 h pretreatment). Treated cells (open graphs) were compared to DMSO controls (gray). H2O2-treated cells (200 mM, 1 h) served as a positive control. Three independent experiments revealed comparable results
Figure 5
Figure 5
Role of Bax. (a) Apoptosis by wortmannin/TRAIL was investigated in HCT-116 parental cells (Bax+, Bak+) and in subclones with knockdown for Bax and/or Bak. Statistical significance of reduced apoptosis in treated subclones is indicated (*P<0.005). Expression of Bax and Bak in the respective cell clones is shown in the inset. (b) Apoptosis (% of sub-G1 cells) and cytotoxicity (% LDH release) are shown after siRNA-mediated Bax knockdown (24 h) in A-375 and Mel-HO treated for 24 h with TRAIL (20 ng/ml)+/− wortmannin (4 μM). The respective mock control (Si-Ctrl) is shown for comparison (Mean values and SDs of two independent experiments, each one with triplicates). Statistical significance is indicated (*P<0.005), when comparing si-Bax and si-Ctrl-transfected cells. Knockdown of Bax is shown by western blotting in insets. Equal protein loading (30 μg per lane) was proven by GAPDH. (c) The mitochondrial Δψm was determined in indicated cell clones treated with wortmannin (4 μM) or wortmannin/TRAIL for 2 h. Treated cells (open graphs) were compared to DMSO controls (gray). (d) ROS levels were determined in HCT-116 parental cells and in subclones with knockdown for Bax and/or Bak treated with wortmannin (4 μM) or wortmannin/TRAIL for 2 h. In each case, three independent experiments with triplicates showed highly comparable results. (e) The mitochondrial membrane potential (Δψm) was determined in A-375, A-375-TS and Mel-HO treated with TRAIL (20 ng/ml) and/or wortmannin (4 μM) for 2 h. Treated cells (open graphs) were compared to DMSO controls (gray). Before, cells were transfected with Bax siRNA (Si-Bax) or the respective control RNA (Si-Ctrl). (f) Mitochondrial extracts (Mito) of A-375 and A-375-TS treated for 2 h with TRAIL +/− wortmannin (4 μM) were analyzed for Bax translocation by western blotting. Equal loading was proven by the mitochondrial protein VDAC; a cytosolic extract is shown for control (Cyto). (g) A-375 and A-375-TS cells were treated for 1–8 h with wortmannin (4 μM) or with wortmannin/TRAIL followed by flow cytometry analysis for Bax conformational changes (Bax-NT antibody; two independent experiments with triplicates). (h) A-375-pIRES and A-375-Bcl-2 cells were treated for 2 h with wortmannin (4 μM)+/− TRAIL (20 ng/ml) followed by flow cytometry analysis for Bax conformational changes (Bax-NT antibody; two independent experiments with triplicates)
Figure 6
Figure 6
Changes at the level of Bax phosphorylation and relation to ROS. (a) Flow cytometry signals for Bax were compared in HCT-116 parental cells (Bax+) and in HCT-116 Bax knockout cells (Bax−/−). Antibodies for total Bax were used, as well as those for Bax phosphorylated at serine-184 and at threonine-167, respectively. Non-treated cells (gray) are shown in overlays with IgG1-stained controls (open graphs). Two independent experiments with triplicates revealed identical results. (b–e) A-375 and A-375-TS were treated for 2 h with wortmannin (4 μM), TRAIL (20 ng/ml) and/or α-tocopherol (200 μM, 1 h pretreatment). The drugs were applied together at and for the same time. For subsequent flow cytometry, cells were stained with antibodies specific for (b) pBax(Ser-184), (c) pBax(Thr-167), (d) activated Bax (Bax-NT) and (e) for total Bax as control. Treated cells (open graphs) are shown in overlays with DMSO controls (gray) and IgG1-stained controls (dashed line). Two complete and independent experiments with triplicates revealed comparable results
Figure 7
Figure 7
Enhanced TRAIL-induced apoptosis and Bax activation by the Akt inhibitor MK-2206. (a) A-375, A-375-TS and Mel-HO cells were treated with increasing concentrations of the allosteric Akt inhibitor MK-2206 (0.5–8 μM), and the effects on Akt phosphorylation (serine-473) were monitored by western blotting after 24 h. Signals of an antibody for total Akt (Akt) served as controls. (b) Apoptosis (percentage of sub-G1 cells) and cytotoxicity (LDH release) were determined in these cells after 24 h of treatment (means and SDs of two independent experiments, each one with triplicates). Statistical significance (*P<0.005) is indicated, when comparing treatments with MK-2206/TRAIL and TRAIL alone. (c) ROS levels were determined by H2DCFDA staining and flow cytometry in A-375 and Mel-HO at 2 h after starting treatment with 20 ng/ml TRAIL, 4 μM MK-2206 and/or α-tocopherol (200 μM, 1 h pretreatment). Treated cells (open graphs) were compared to DMSO controls (gray). Two independent experiments (each with triplicates) revealed comparable results. (d) Flow cytometry signals for Bax phosphorylation (Ser-184; Thr-167) and Bax activation (Bax-NT) were compared in A-375, A-375-TS and Mel-HO cells after 2 h treatment with TRAIL (20 ng/ml), MK-2206 (4 μM) and MK-2206/TRAIL. Treated cells (open graphs) are shown in overlays with DMSO controls (gray). Two complete and independent experiments with triplicates revealed the same results
Figure 8
Figure 8
NOX4 is essential for wortmannin-induced ROS production. (a) Apoptosis (% of sub-G1 cells) and cytotoxicity (% LDH release) in response to 24 h treatment with TRAIL (20 ng/ml) and/or wortmannin (4 μM) was monitored in A-375 and Mel-HO after siRNA-mediated knockdown of NOX4. The respective mock control (Si-Ctrl) is shown for comparison. Mean values and SDs of two independent experiments, each with triplicates, are shown, and statistical significance is indicated (*P<0.005) when comparing NOX4 and mock-transfected cells after TRAIL/wortmannin treatment. Knockdown of NOX4 (70 kDa), as determined by western blotting, is shown in insets; equal protein loading (30 μg per lane) was proven by GAPDH. (b) ROS levels were determined by H2DCFDA staining and flow cytometry in A-375 and Mel-HO after transfection with siRNA for NOX4 (Si-NOX4) and control siRNA (Si-Ctrl). Treatments with 20 ng/ml TRAIL +/− 4 μM wortmannin were for 2 h. Treated cells (open graphs) are compared to DMSO controls (gray). Two independent experiments (triplicates) revealed comparable results. (c) Flow cytometry signals for Bax phosphorylation (Ser-184, Thr-167) and Bax activation (Bax-NT) were compared in A-375, A-375-TS and Mel-HO cells transfected with NOX4 siRNA or control siRNA (Si-Ctrl). Treatments with TRAIL (20 ng/ml) +/− wortmannin (4 μM) were for 2 h. Treated cells (open graphs) are shown in overlays with DMSO controls (gray). Two complete and independent experiments with triplicates revealed comparable results. (d) The suggested pathways induced by wortmannin/TRAIL are explaned within the text

References

    1. Krammer PH, Arnold R, Lavrik IN. Life and death in peripheral T cells. Nat Rev Immunol. 2007;7:532–542. - PubMed
    1. Norberg E, Orrenius S, Zhivotovsky B. Mitochondrial regulation of cell death: processing of apoptosis-inducing factor (AIF) Biochem Biophys Res Co. 2010;396:95–100. - PubMed
    1. Tait SWG, Green DR. Mitochondria and cell death: outer membrane permeabilization and beyond. Nat Rev Mol Cell Bio. 2010;11:621–632. - PubMed
    1. Fischer U, Janicke RU, Schulze-Osthoff K. Many cuts to ruin: a comprehensive update of caspase substrates. Cell Death Differ. 2003;10:76–100. - PMC - PubMed
    1. Chipuk JE, Moldoveanu T, Llambi F, Parsons MJ, Green DR. The BCL-2 family reunion. Mol Cell. 2010;37:299–310. - PMC - PubMed

Publication types

MeSH terms