Death receptor 6 (DR6) antagonist antibody is neuroprotective in the mouse SOD1G93A model of amyotrophic lateral sclerosis
- PMID: 24113175
- PMCID: PMC3824687
- DOI: 10.1038/cddis.2013.378
Death receptor 6 (DR6) antagonist antibody is neuroprotective in the mouse SOD1G93A model of amyotrophic lateral sclerosis
Abstract
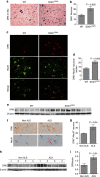
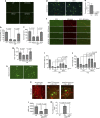
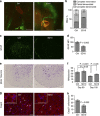
Amyotrophic lateral sclerosis (ALS) is a neurodegenerative disease characterized by the death of motor neurons, axon degeneration, and denervation of neuromuscular junctions (NMJ). Here we show that death receptor 6 (DR6) levels are elevated in spinal cords from post-mortem samples of human ALS and from SOD1(G93A) transgenic mice, and DR6 promotes motor neuron death through activation of the caspase 3 signaling pathway. Blocking DR6 with antagonist antibody 5D10 promotes motor neuron survival in vitro via activation of Akt phosphorylation and inhibition of the caspase 3 signaling pathway, after growth factor withdrawal, sodium arsenite treatment or co-culture with SOD1(G93A) astrocytes. Treatment of SOD1(G93A) mice at an asymptomatic stage starting on the age of 42 days with 5D10 protects NMJ from denervation, decreases gliosis, increases survival of motor neurons and CC1(+) oligodendrocytes in spinal cord, decreases phosphorylated neurofilament heavy chain (pNfH) levels in serum, and promotes motor functional improvement assessed by increased grip strength. The combined data provide clear evidence for neuroprotective effects of 5D10. Blocking DR6 function represents a new approach for the treatment of neurodegenerative disorders involving motor neuron death and axon degeneration, such as ALS.
Figures


Similar articles
-
Fasudil, a rho kinase inhibitor, limits motor neuron loss in experimental models of amyotrophic lateral sclerosis.Br J Pharmacol. 2013 Sep;170(2):341-51. doi: 10.1111/bph.12277. Br J Pharmacol. 2013. PMID: 23763343 Free PMC article.
-
Toll-Like Receptor-4 Inhibitor TAK-242 Attenuates Motor Dysfunction and Spinal Cord Pathology in an Amyotrophic Lateral Sclerosis Mouse Model.Int J Mol Sci. 2017 Aug 1;18(8):1666. doi: 10.3390/ijms18081666. Int J Mol Sci. 2017. PMID: 28763002 Free PMC article.
-
Neuroprotective effects of JGK-263 in transgenic SOD1-G93A mice of amyotrophic lateral sclerosis.J Neurol Sci. 2014 May 15;340(1-2):112-6. doi: 10.1016/j.jns.2014.03.008. Epub 2014 Mar 12. J Neurol Sci. 2014. PMID: 24680562
-
Update on the pathological roles of prostaglandin E2 in neurodegeneration in amyotrophic lateral sclerosis.Transl Neurodegener. 2023 Jun 19;12(1):32. doi: 10.1186/s40035-023-00366-w. Transl Neurodegener. 2023. PMID: 37337289 Free PMC article. Review.
-
Roles of vascular endothelial growth factor in amyotrophic lateral sclerosis.Biomed Res Int. 2014;2014:947513. doi: 10.1155/2014/947513. Epub 2014 Apr 29. Biomed Res Int. 2014. PMID: 24987705 Free PMC article. Review.
Cited by
-
Death receptor 6 promotes ovarian cancer cell migration through KIF11.FEBS Open Bio. 2018 Aug 7;8(9):1497-1507. doi: 10.1002/2211-5463.12492. eCollection 2018 Sep. FEBS Open Bio. 2018. PMID: 30186750 Free PMC article.
-
TDP-43 induces p53-mediated cell death of cortical progenitors and immature neurons.Sci Rep. 2018 May 25;8(1):8097. doi: 10.1038/s41598-018-26397-2. Sci Rep. 2018. PMID: 29802307 Free PMC article.
-
Role of SARM1 and DR6 in retinal ganglion cell axonal and somal degeneration following axonal injury.Exp Eye Res. 2018 Jun;171:54-61. doi: 10.1016/j.exer.2018.03.007. Epub 2018 Mar 8. Exp Eye Res. 2018. PMID: 29526794 Free PMC article.
-
Clemastine Confers Neuroprotection and Induces an Anti-Inflammatory Phenotype in SOD1(G93A) Mouse Model of Amyotrophic Lateral Sclerosis.Mol Neurobiol. 2016 Jan;53(1):518-531. doi: 10.1007/s12035-014-9019-8. Epub 2014 Dec 9. Mol Neurobiol. 2016. PMID: 25482048
-
Tumour-cell-induced endothelial cell necroptosis via death receptor 6 promotes metastasis.Nature. 2016 Aug 11;536(7615):215-8. doi: 10.1038/nature19076. Epub 2016 Aug 3. Nature. 2016. PMID: 27487218
References
-
- Cleveland DW, Rothstein JD. From Charcot to Lou Gehrig: deciphering selective motor neuron death in ALS. Nat Rev Neurosci. 2001;2:806–819. - PubMed
-
- Andersen PM, Al-Chalabi A. Clinical genetics of amyotrophic lateral sclerosis: what do we really know. Nat Rev Neurol. 2011;7:603–615. - PubMed
-
- Johnston CA, Stanton BR, Turner MR, Gray R, Blunt AH, Butt D, et al. Amyotrophic lateral sclerosis in an urban setting: a population based study of inner city London. J Neurol. 2006;253:1642–1643. - PubMed
-
- Rosen DR, Siddique T, Patterson D, Figlewicz DA, Sapp P, Hentati A, et al. Mutations in Cu/Zn superoxide dismutase gene are associated with familial amyotrophic lateral sclerosis. Nature. 1993;362:59–62. - PubMed
MeSH terms
Substances
LinkOut - more resources
Full Text Sources
Other Literature Sources
Medical
Molecular Biology Databases
Research Materials
Miscellaneous

