. 2013 Oct 10;4(10):e848.
doi: 10.1038/cddis.2013.339.

Loss of TAK1 increases cell traction force in a ROS-dependent manner to drive epithelial-mesenchymal transition of cancer cells

Affiliations

Loss of TAK1 increases cell traction force in a ROS-dependent manner to drive epithelial-mesenchymal transition of cancer cells

C R I Lam et al. Cell Death Dis. .

Abstract

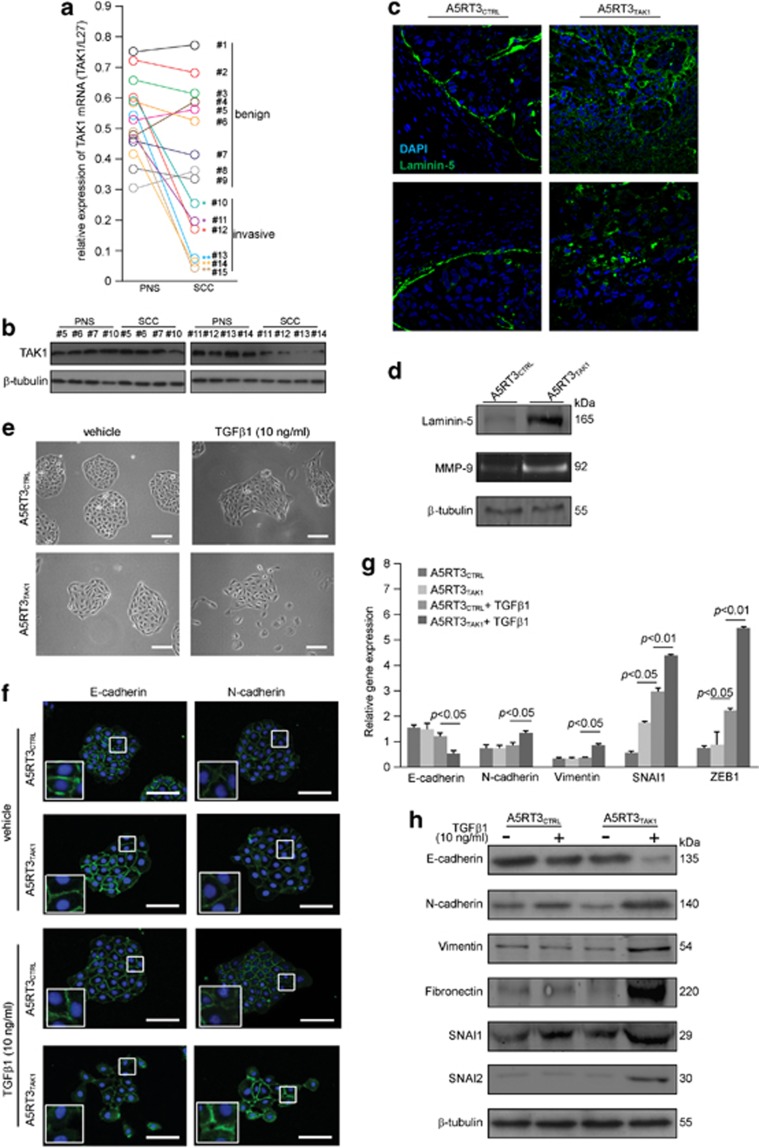
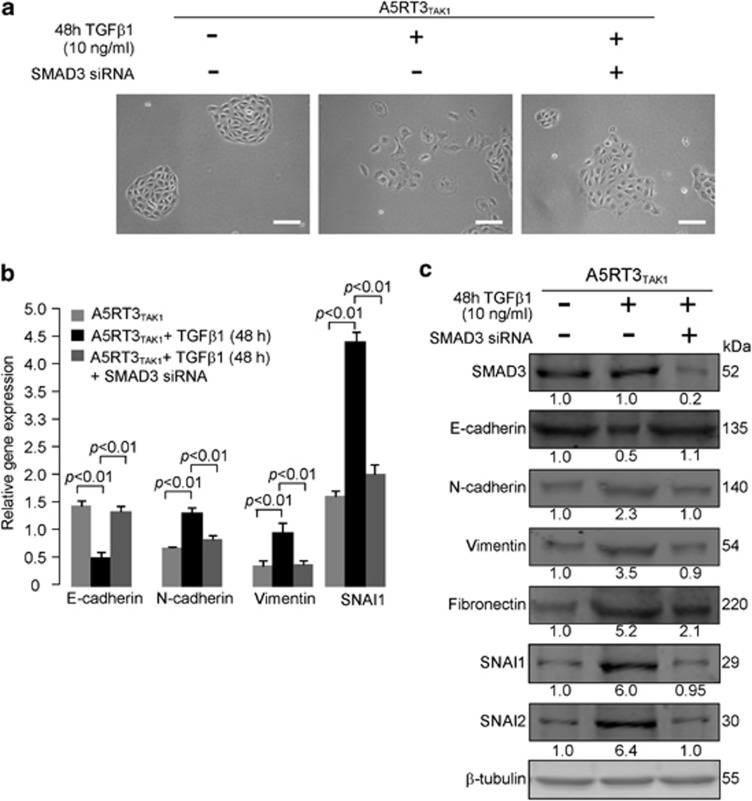
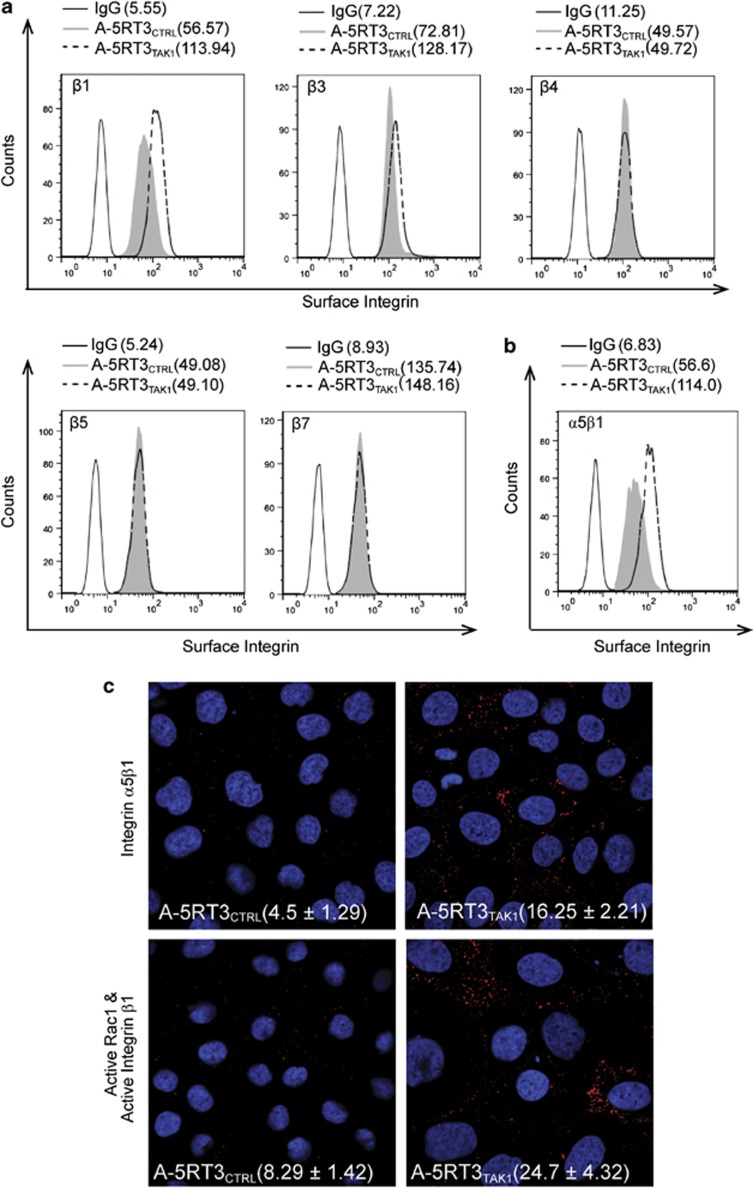
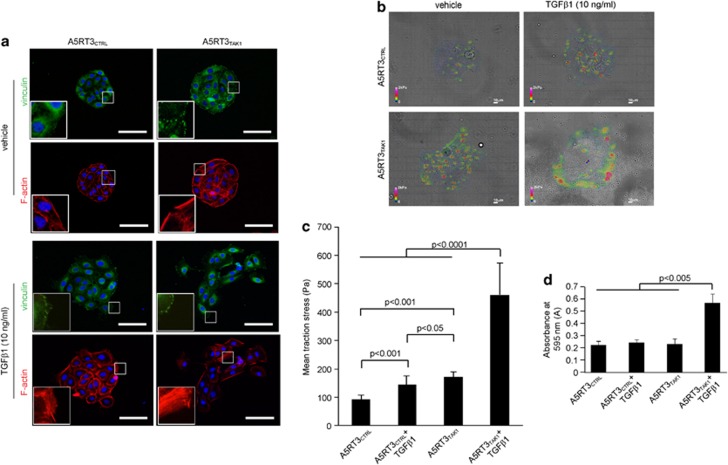
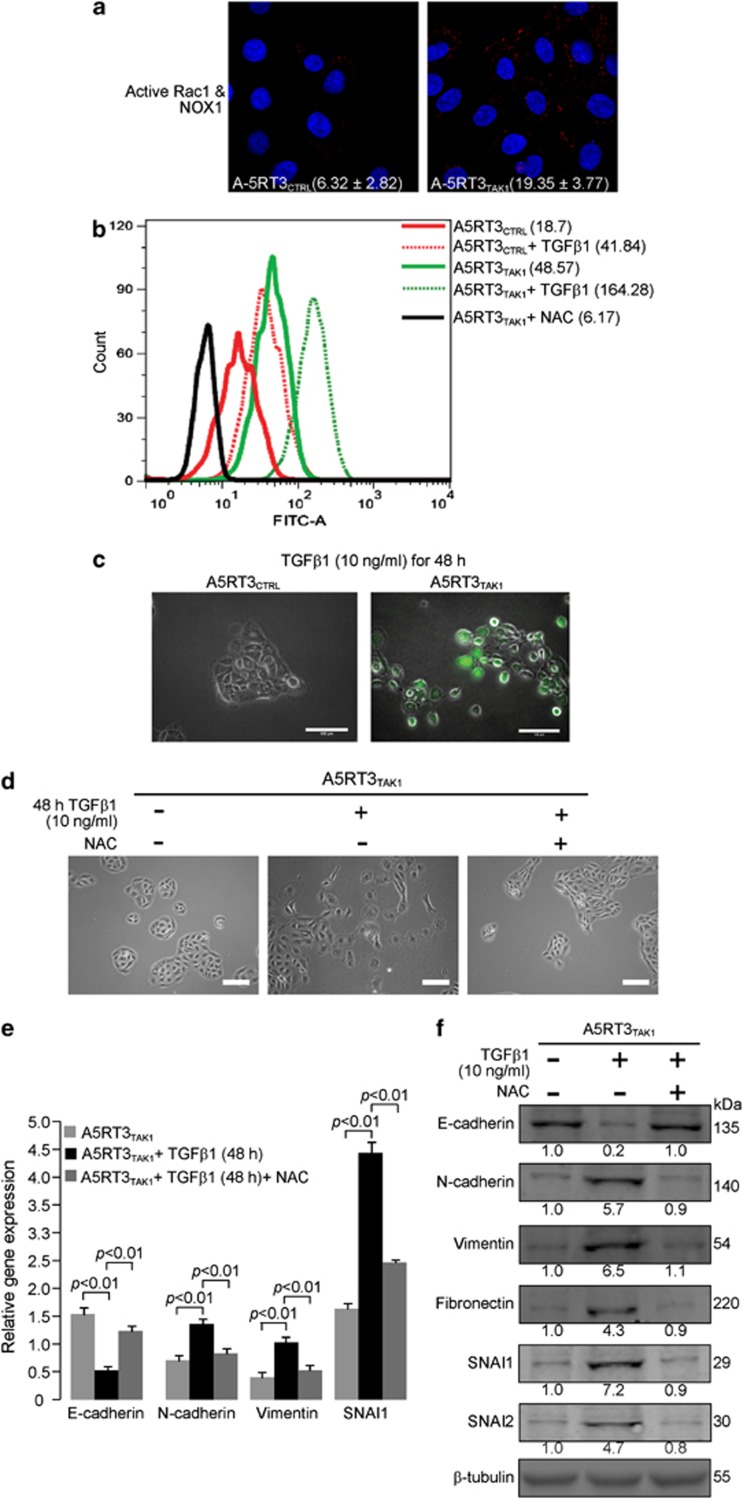
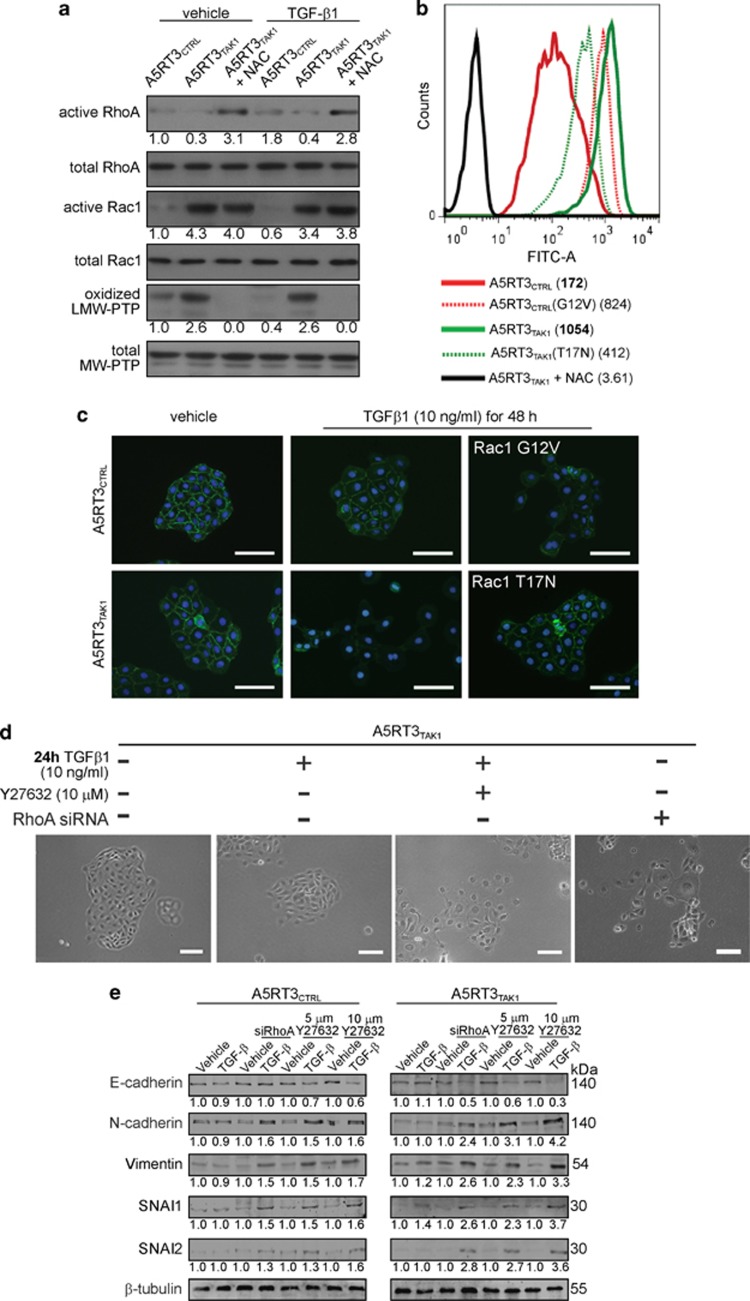
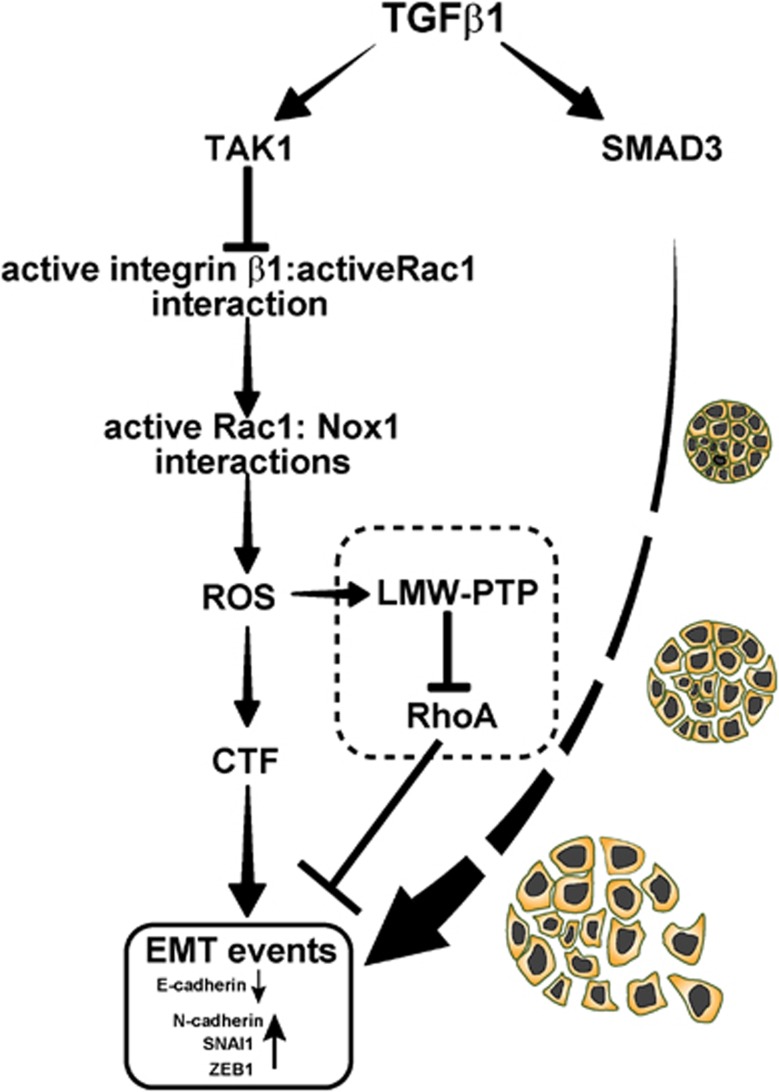
Epithelial-mesenchymal transition (EMT) is a crucial step in tumor progression, and the TGFβ-SMAD signaling pathway as an inductor of EMT in many tumor types is well recognized. However, the role of non-canonical TGFβ-TAK1 signaling in EMT remains unclear. Herein, we show that TAK1 deficiency drives metastatic skin squamous cell carcinoma earlier into EMT that is conditional on the elevated cellular ROS level. The expression of TAK1 is consistently reduced in invasive squamous cell carcinoma biopsies. Tumors derived from TAK1-deficient cells also exhibited pronounced invasive morphology. TAK1-deficient cancer cells adopt a more mesenchymal morphology characterized by higher number of focal adhesions, increase surface expression of integrin α5β1 and active Rac1. Notably, these mutant cells exert an increased cell traction force, an early cellular response during TGFβ1-induced EMT. The mRNA level of ZEB1 and SNAIL, transcription factors associated with mesenchymal phenotype is also upregulated in TAK1-deficient cancer cells compared with control cancer cells. We further show that TAK1 modulates Rac1 and RhoA GTPases activities via a redox-dependent downregulation of RhoA by Rac1, which involves the oxidative modification of low-molecular weight protein tyrosine phosphatase. Importantly, the treatment of TAK1-deficient cancer cells with Y27632, a selective inhibitor of Rho-associated protein kinase and antioxidant N-acetylcysteine augment and hinders EMT, respectively. Our findings suggest that a dysregulated balance in the activation of TGFβ-TAK1 and TGFβ-SMAD pathways is pivotal for TGFβ1-induced EMT. Thus, TAK1 deficiency in metastatic cancer cells increases integrin:Rac-induced ROS, which negatively regulated Rho by LMW-PTP to accelerate EMT.


Figures

Figure 1
Figure 1
TAK1 deficiency promotes TGFβ1 induced EMT in A5RT3 cells. (a and b) Relative mRNA (a) and protein (b) expression of TAK1 in human squamous cell carcinomas (SCC) biopsies and their cognate perilesional normal skin (PNS). Biopsies #1–9 and #10–15 are benign and invasive grades SCC samples, respectively. Biopsies #5–7 and #10–14 were used for western blot analysis. For qPCR, data points from the same individual are linked by colored lines. (c) Immunofluorescence staining of laminin-332 (green) in cryosections of A5RT3CTRL- and A5RT3TAK1-derived tumors. Nuclei were counterstained with DAPI (blue). (d) Expression of invasive markers laminin-332 and MMP-9 in A5RT3CTRL- and A5RT3TAK1-derived tumors as determined by immunoblot and gelatin zymography, respectively. Values below each band represent the mean fold differences (n=3) in expression level when compared with A5RT3CTRL-derived tumor. (e) Phase-contrast microscopy images of A5RT3CTRL and A5RT3TAK1 cell colonies 48 h after TGFβ1 treatment. Scale bar, 100 μm. (f) Immunostaining of E-cadherin and N-cadherin (green) in A5RT3CTRL and A5RT3TAK1 cells under the indicated treatment. Nuclei were counterstained with DAPI (blue). Scale bar, 100 μm. (g) qPCR analysis of EMT markers in A5RT3CTRL and A5RT3TAK1 24 h after TGFβ1 treatment. Samples were normalized with reference gene, L27. (h) Representative western blots of EMT markers in A5RT3CTRL and A5RT3TAK1 48 h after TGFβ1 treatment. The densitometry values as indicated below respective lanes were normalized with respect to the control. For western blot, β-tubulin was used as a loading control. For qPCR, all samples were normalized with housekeeping gene L27 gene. Data represent means±S.D.; n=3
Figure 2
Figure 2
TGFβ1-induced EMT is effected through SMAD signaling. (a) Phase-contrast images of SMAD3 siRNA-transfected A5RT3TAK1 and respective control cells with 48 h of TGFβ1 (10 ng/ml) treatment. Scale bar, 100 μm. (b) qPCR analysis of EMT markers in SMAD3 siRNA-transfected A5RT3TAK1 cells with and without TGFβ1 treatment. (c) Immunoblot analysis of SMAD3 siRNA-transfected A5RT3TAK1 cells for their knockdown and EMT markers upon TGFβ1 treatment. Representative blots were shown with respective densitometry values indicated below lanes, normalized with respect to the control. For western blot, β-tubulin was used as a loading control. For qPCR, all samples were normalized with housekeeping gene L27 gene. Data represent means±S.D.; n=3
Figure 3
Figure 3
Expression of surface integrin in A5RT3CTRL and A5RT3TAK1. (a and b) FACS analysis of A5RT3CTRL and A5RT3TAK1 cells immunostained with antibodies against indicated surface integrin β subunits (a) and with integrin α5β1 (b). The distribution of tumor cells with regard to their extent of integrin staining was presented in histogram plots with the identity of the stained integrin subunit indicated (top left). Cells stained with only control IgG served as the negative controls. Each image is representative of at least three different experiments. Values shown indicate mean fluorescence intensity. (c) PLA assay of α5β1 integrin expression (upper panel) and active integrin β1:active Rac1 (lower panel) n A5RT3CTRL and A5RT3TAK1 cells. Representative images were shown with mean number of PLA spots per nucleus±S.D. indicated; n=3
Figure 4
Figure 4
TAK1 deficiency increases cell traction force in A-5RT3 facilitating EMT. (a) Vinculin immunostaining (green) and phalloidin F-actin (red) staining were conducted of A5RT3CTRL and A5RT3TAK1 cell colonies with and without TGFβ1 treatment for 48 h with representative images shown. Scale bar, 100 μm. (b and c) Cell traction force profiling (b) and mean measured cell traction stress (c) of A5RT3CTRL and A5RT3TAK1 with and without TGFβ1 (10 ng/ml) treatment for 24 h. Color scale bar denotes traction stress (kPa). Scale bar, 10 μm. Values (mean+S.D.) of three independent measurements. (d) A5RT3CTRL and A5RT3TAK1 cells were seeded on a transwell membrane of pore size and evaluated for their migration through the pore with and without TGFβ1 treatment for 48 h. Migrated cells were stained with crystal violet and destained with a fixed volume of 0.5% Triton-X solution. Absorbance at 595 nm of the solutions was measured to quantify transwell migration. Graph displays mean absorbance values±S.D.; n=3
Figure 5
Figure 5
Role of elevated ROS during TGFβ1-induced EMT in A5RT3TAK1. (a) PLA assay of active Rac1 and Nox1 in A5RT3CTRL and A5RT3TAK1 cell. Representative images were shown with mean number of PLA spots per nucleus±S.D. indicated; n=3. (b) A5RT3CTRL and A5RT3TAK1 with or without 48 h of TGFβ1 (10 ng/ml) treatment were stained with DCF and analyzed with flow cytometry. Antioxidant NAC-treated cells (100 μM) served as a negative control. Image shown is representative of three different experiments. Values shown indicate mean fluorescence intensity. (c) Phase-contrast images showing DCF staining of A5RT3CTRL and A5RT3TAK1 after 48 h of TGFβ1 (10 ng/ml) treatment. Scale bar, 100μm. (d) Phase-contrast images A5RT3TAK1 cells subjected to indicated treatements. NAC (100 μM) was used to quench ROS. Scale bar, 100 μm. (e) qPCR analysis of EMT markers in TGFβ1 induced A5RT3TAK1 with NAC treatment. Samples were normalized with reference gene, L27. (f) Representative blots of EMT markers in TGFβ1 induced A5RT3TAK1 with NAC treatment were shown with densitometry values indicated below respective lanes. Samples were normalized with tubulin as a loading control. Data represent means±S.D.; n=3
Figure 6
Figure 6
Redox regulation of RhoA by Rac1 facilitates TGFβ1 induced EMT. (a) RhoA and Rac1 activities and LMW-PTP oxidation were compared with immunoblotting as respectively indicated. 10 ng/ml TGFβ1 and 100 μM of antioxidant NAC were used respectively for treatment duration of 48 h. (b) FACS analysis of tumor cells transfected with or without constitutive-active (G12V) and dominant-negative Rac1 (T17N). Antioxidant NAC-treated cells (100 μM) served as a negative control. Values shown indicate mean fluorescence intensity. (c) Representative images of E-cadherin (green/488 nm) immunostaining of tumor cells with respectively indicated treatments and transfection. Cell nucleus is stained with DAPI (blue). Scale bar, 100 μm. (d) Phase-contrast images of A5RT3TAK1 cells with and without TGFβ1 induction were inhibited with Y27632 (10 μM) for 24 h or transfected with siRNA for RhoA. Representative phase-contrast images of treated cells. Scale bar, 100 μm. (e) Representative blots of EMT markers in TGFβ1-induced A5RT3CTRL and A5RT3TAK1 treated with ROCK Y27632 or transfected with pooled siRNA for RhoA. Values shown with densitometry values indicated below respective lanes. Samples were normalized with tubulin as a loading control. Data represent means±S.D.; n=3
Figure 7
Figure 7
Proposed mechanism by which TAK1 inhibits TGFβ1-induced EMT. TAK1 likely counters the well-established TGFβ1-SMAD3 induction of EMT with the suppression of integrin expression and hence Rac1 activation. Rac activity otherwise promotes ROS production via the recruitment of Nox1, which oxidizes LMW-PTP and correspondingly inhibit RhoA activity, promoting EMT. Elevated ROS also leads to increased CTF, a characteristic of EMT progression

References

    1. Mehlen P, Puisieux A. Metastasis: a question of life or death. Nat Rev Cancer. 2006;6:449–458. - PubMed
    1. Kalluri R, Weinberg RA. The basics of epithelial-mesenchymal transition. J Clin Invest. 2009;119:1420–1428. - PMC - PubMed
    1. Coussens LM, Werb Z. Inflammation and cancer. Nature. 2002;420:860–867. - PMC - PubMed
    1. Ikushima H, Miyazono K. TGFbeta signalling: a complex web in cancer progression. Nat Rev Cancer. 2010;10:415–424. - PubMed
    1. Zavadil J, Böttinger EP. TGF-beta and epithelial-to-mesenchymal transitions. Oncogene. 2005;24:5764–5774. - PubMed

Publication types

MeSH terms