

doi: 10.1038/srep02924.
Correlative multimodal probing of ionically-mediated electromechanical phenomena in simple oxides
Affiliations
- PMID: 24113291
- PMCID: PMC3795354
- DOI: 10.1038/srep02924
Item in Clipboard
Correlative multimodal probing of ionically-mediated electromechanical phenomena in simple oxides
Sci Rep.
.
Abstract
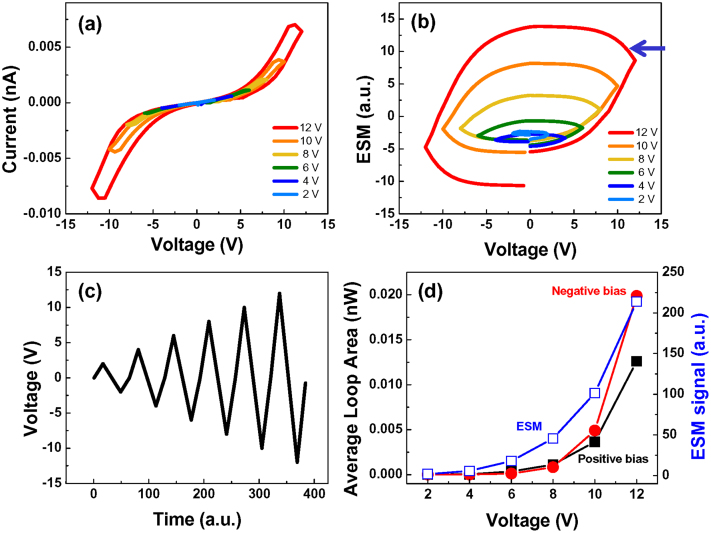
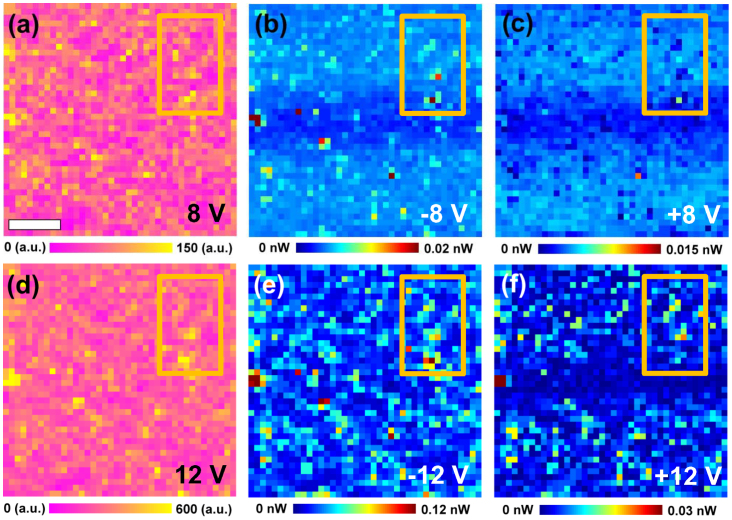
The local interplay between the ionic and electronic transport in NiO is explored using correlative imaging by first-order reversal curve measurements in current-voltage and electrochemical strain microscopy. Electronic current and electromechanical response are observed in reversible and electroforming regime. These studies provide insight into local mechanisms of electroresistive phenomena in NiO and establish universal method to study interplay between the ionic and electronic transport and electrochemical transformations in mixed electronic-ionic conductors.
Figures
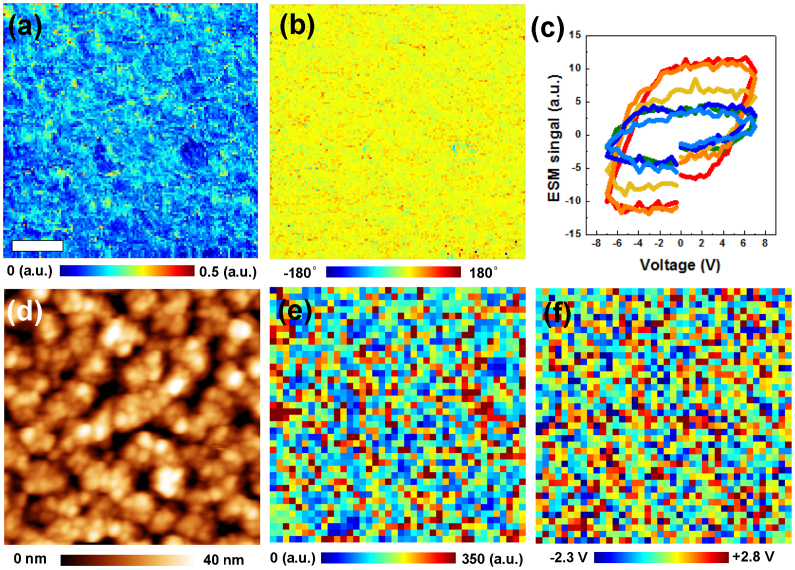
ESM (a) amplitude and (b) phase images. (c) Selected ESM hysteresis loops as measured at different locations. (d) Topography and spatial maps of (e) work of switching (area under the loop) and (f) imprint (difference between x-intercepts). Scale bar is 200 nm.
Scale bar is 200 nm.
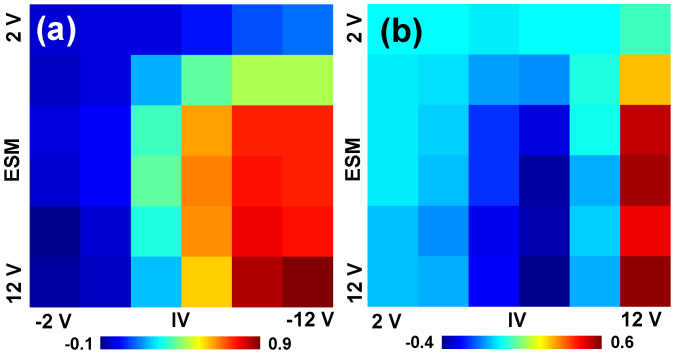
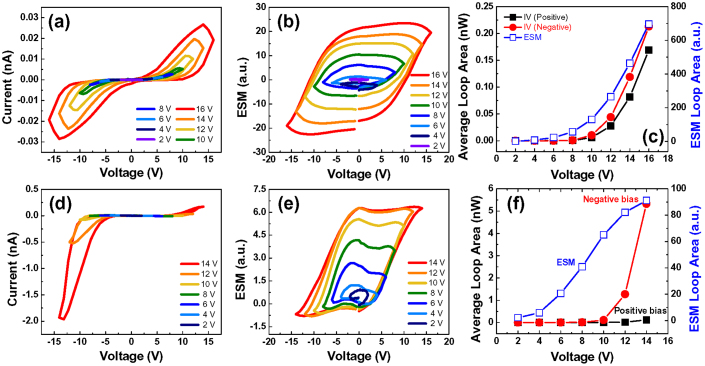
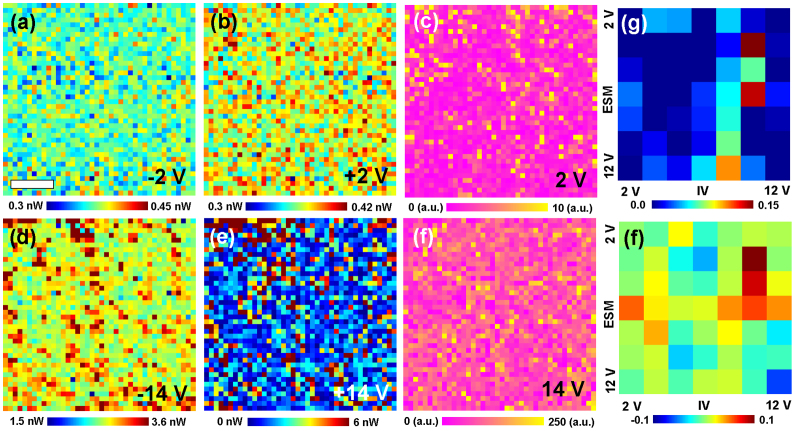
Correlation between ESM loop area and I-V loop area for (g) negative and (h) positive biases.
Similar articles
-
Spatially-resolved mapping of history-dependent coupled electrochemical and electronical behaviors of electroresistive NiO.Sci Rep. 2014 Oct 22;4:6725. doi: 10.1038/srep06725. Sci Rep. 2014. PMID: 25335689 Free PMC article.
-
Probing local ionic dynamics in functional oxides at the nanoscale.Nano Lett. 2013 Aug 14;13(8):3455-62. doi: 10.1021/nl400780d. Epub 2013 Jul 24. Nano Lett. 2013. PMID: 23865960
-
Probing the Ionic and Electrochemical Phenomena during Resistive Switching of NiO Thin Films.ACS Appl Mater Interfaces. 2018 Mar 7;10(9):8092-8101. doi: 10.1021/acsami.7b16188. Epub 2018 Feb 23. ACS Appl Mater Interfaces. 2018. PMID: 29424523
-
Mini-Review: Mixed Ionic-Electronic Charge Carrier Localization and Transport in Hybrid Organic-Inorganic Nanomaterials.Front Chem. 2020 Jul 14;8:537. doi: 10.3389/fchem.2020.00537. eCollection 2020. Front Chem. 2020. PMID: 32760697 Free PMC article. Review.
-
Organic mixed ionic-electronic conductors.Nat Mater. 2020 Jan;19(1):13-26. doi: 10.1038/s41563-019-0435-z. Epub 2019 Aug 19. Nat Mater. 2020. PMID: 31427743 Review.
Cited by
-
Big data and deep data in scanning and electron microscopies: deriving functionality from multidimensional data sets.Adv Struct Chem Imaging. 2015;1:6. doi: 10.1186/s40679-015-0006-6. Epub 2015 May 13. Adv Struct Chem Imaging. 2015. PMID: 27547705 Free PMC article. Review.
-
Solid-state electrochemistry on the nanometer and atomic scales: the scanning probe microscopy approach.Nanoscale. 2016 Aug 7;8(29):13838-58. doi: 10.1039/c6nr01524g. Epub 2016 May 5. Nanoscale. 2016. PMID: 27146961 Free PMC article.
-
Probing of multiple magnetic responses in magnetic inductors using atomic force microscopy.Sci Rep. 2016 Feb 8;6:20794. doi: 10.1038/srep20794. Sci Rep. 2016. PMID: 26852801 Free PMC article.
-
Spatially-resolved mapping of history-dependent coupled electrochemical and electronical behaviors of electroresistive NiO.Sci Rep. 2014 Oct 22;4:6725. doi: 10.1038/srep06725. Sci Rep. 2014. PMID: 25335689 Free PMC article.
-
Conductance Quantization in Resistive Random Access Memory.Nanoscale Res Lett. 2015 Dec;10(1):420. doi: 10.1186/s11671-015-1118-6. Epub 2015 Oct 26. Nanoscale Res Lett. 2015. PMID: 26501832 Free PMC article.
References
-
- Bagotsky V. S. Fuel Cells: problems and solutions. (Wiley, 2009).
-
- Kendall, K. & Singhal, S. C. (ed.) High-temperature solid oxide fuel cells: fundamentals, design and applications (Elsevier Science, 2003).
-
- Granqvist C. G. Oxide electrochromics: an introduction to devices and materials. Sol. Energy Mater. Sol. Cells 99, 1–13 (2012).
-
- Szot K. et al. TiO2-a prototypical memristive material. Nanotechnology 22, 254001 (2011). - PubMed
-
- Coherer, http://en.wikipedia.org/wiki/Coherer (2013) Date of acess 03/10/2013.
Publication types
LinkOut - more resources
Full Text Sources
Other Literature Sources
