. 2013:4:2532.
doi: 10.1038/ncomms3532.

Septins promote dendrite and axon development by negatively regulating microtubule stability via HDAC6-mediated deacetylation

Affiliations

Septins promote dendrite and axon development by negatively regulating microtubule stability via HDAC6-mediated deacetylation

Natsumi Ageta-Ishihara et al. Nat Commun. 2013.

Abstract

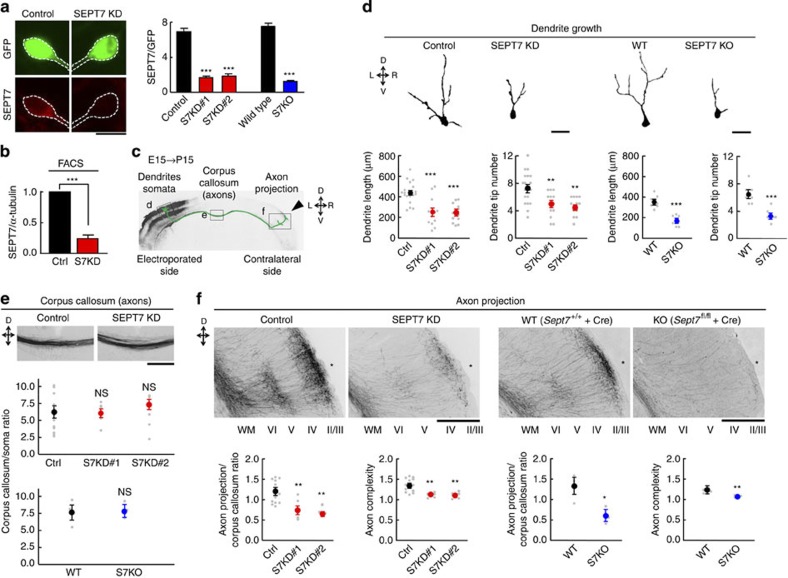
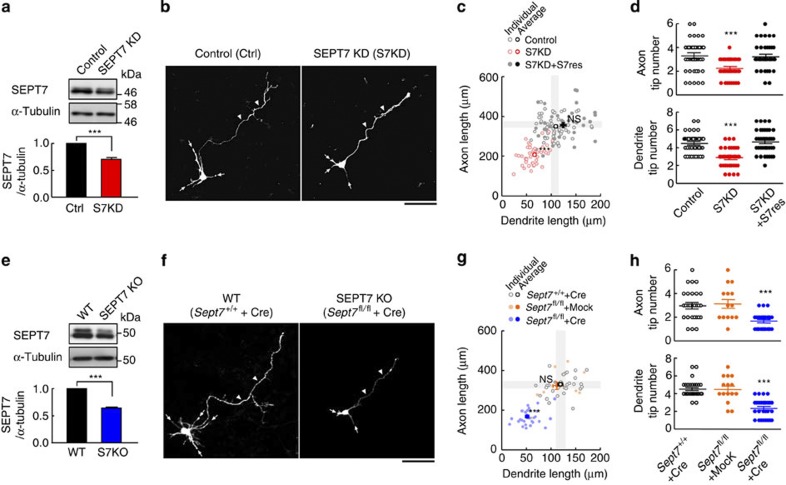
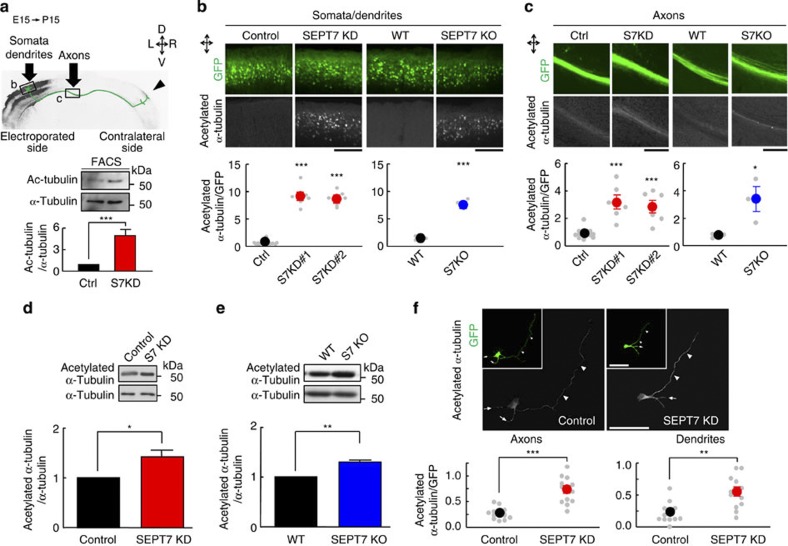
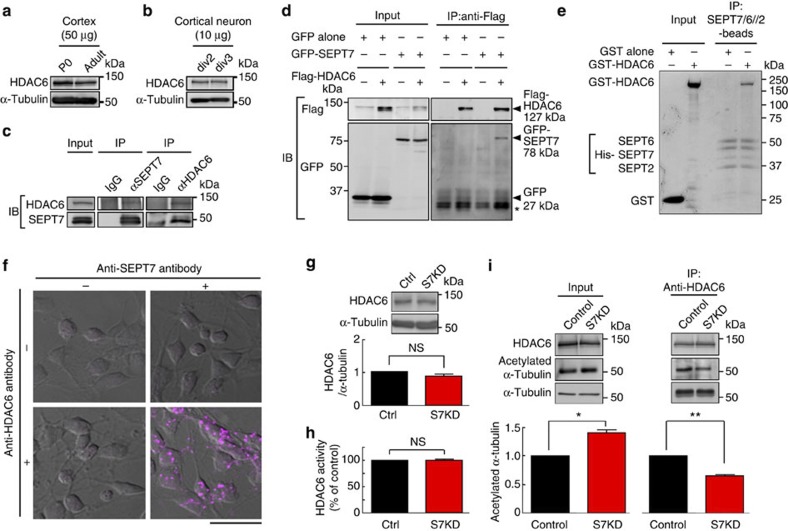
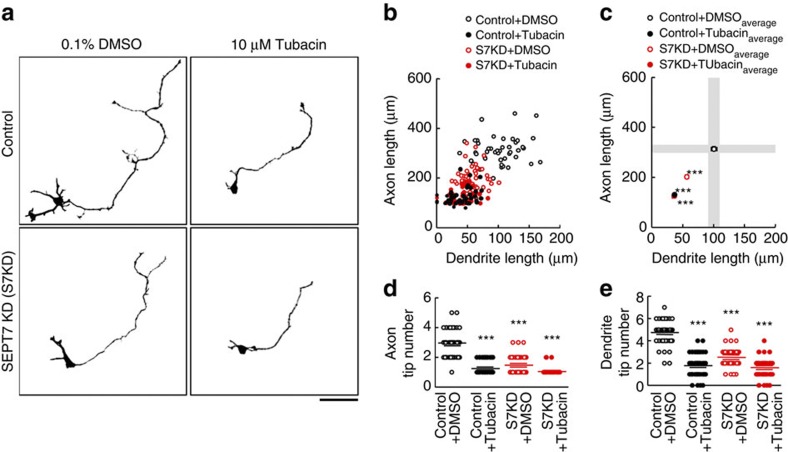
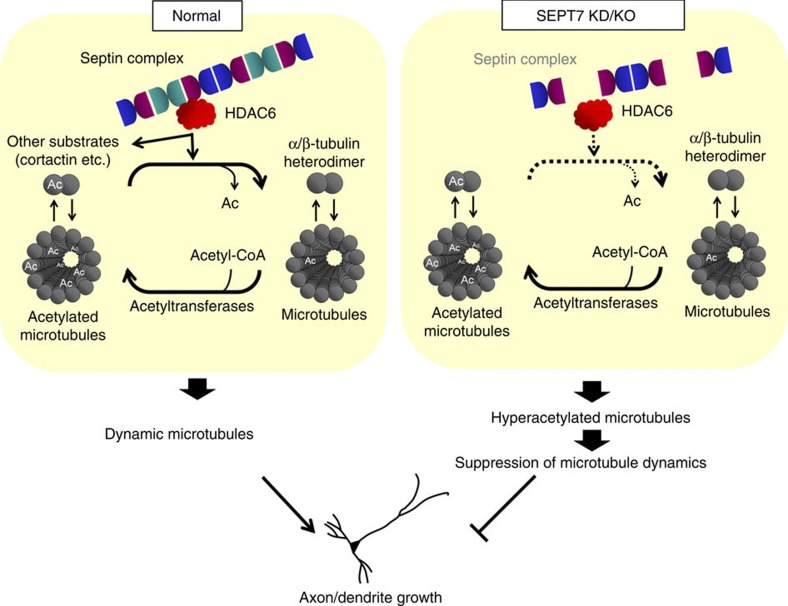
Neurite growth requires two guanine nucleotide-binding protein polymers of tubulins and septins. However, whether and how those cytoskeletal systems are coordinated was unknown. Here we show that the acute knockdown or knockout of the pivotal septin subunit SEPT7 from cerebrocortical neurons impairs their interhemispheric and cerebrospinal axon projections and dendritogenesis in perinatal mice, when the microtubules are severely hyperacetylated. The resulting hyperstabilization and growth retardation of microtubules are demonstrated in vitro. The phenotypic similarity between SEPT7 depletion and the pharmacological inhibition of α-tubulin deacetylase HDAC6 reveals that HDAC6 requires SEPT7 not for its enzymatic activity, but to associate with acetylated α-tubulin. These and other findings indicate that septins provide a physical scaffold for HDAC6 to achieve efficient microtubule deacetylation, thereby negatively regulating microtubule stability to an optimal level for neuritogenesis. Our findings shed light on the mechanisms underlying the HDAC6-mediated coupling of the two ubiquitous cytoskeletal systems during neural development.


Figures

Figure 1
Figure 1. The core septin subunit SEPT7 is required for the growth of dendrites and axons of cerebrocortical neurons in vivo.
(a) Representative immunofluorescence images of primary cerebrocortical neurons at div2 co-expressing GFP with control (left) or shRNA#1 against SEPT7 (right). Endogenous SEPT7 (red) is depleted in GFP-positive transfectants (green). Scale bar, 10 μm. Graph: SEPT7 depletion efficiency (SEPT7/GFP immunofluorescence ratio) via RNAi (S7KD#1, #2) or acute gene disruption (S7KO). (n=12. ***P<0.001 by one-way ANOVA with post hoc Tukey for KD, t-test for KO). Error bars denote s.e.m. (b) SEPT7 depletion efficiency (SEPT7/α-tubulin immunofluorescence ratio) in vivo via RNAi (S7KD#1). FACS-sorted GFP-positive neurons from P2 cerebral cortices were immunoblotted. Triplicated experiments. (***P<0.001 by t-test. See Supplementary Fig. S2). Error bars denote s.e.m. (c) P15 mouse coronal section with a layer II/III pyramidal neuron in the somatosensory cortex (S1/S2). Prospective layer II/III pyramidal neurons were subjected to KD/KO at E15 and analysed at P15 for the dendrites (d), callosal axon bundles (e) and axon terminals in the contralateral S1/S2 (f). (d) Representative projected images of GFP-positive layer II/III pyramidal neurons. Scale bars, 50 μm. Graph: SEPT7 depletion via KD/KO consistently reduced the total length and tip number of dendrites. (KD; n=18, 12, 12. ***P<0.001 by one-way ANOVA with post hoc Tukey. KO; n=7, ***P<0.001, t-test). Error bars denote s.e.m. (e) Representative images of GFP-positive axon bundles at the corpus callosum. Scale bar, 250 μm. Graph: SEPT7 depletion did not affect the axon projection up to the midline. (KD; n=12, 6, 6. NS, P>0.05 by one-way ANOVA with post hoc Tukey. KO; n=3. NS, P>0.05 by t-test). Error bars denote s.e.m. (f) Representative images of GFP-positive axon terminals projecting toward the contralateral S1/S2 (asterisk). The axon terminals branch and terminate at layers V and II/III. Layers (II/III to VI) and white matter (WM) are labelled at the bottom. Scale bars, 500 μm. Graph: GFP-fluorescence intensity in layers II/III normalized to the corpus callosum and the axon complexity at a distal segment (the ratio of the number of branches that entered layer IV over that at layer V) were significantly diminished in SEPT7-depleted neurons. Thus, the terminal extension and branching of axons were consistently impaired via RNAi and gene disruption. (KD; n=12, 6, 6. **P<0.01 by one-way ANOVA with post hoc Tukey. KO; n=3. **P<0.01, *P<0.05 by t-test). Error bars denote s.e.m.
Figure 2
Figure 2. In vitro rescue and morphometry of the SEPT7-depletion phenotype on dendrite/axon growth.
(a) Immunoblot estimation of the gross efficiency (including GFP-negative untransfected population) of SEPT7 depletion from wild-type E17 embryo-derived neurons via S7KD#1 RNAi (div2). Each lane contained 10 μg protein. (Triplicated experiments. ***P<0.001 by t-test). Error bars denote s.e.m. (b) Representative images for the morphometry of GFP-positive pyramidal-like neurons with dendrites (arrows) and axons (arrowheads). Scale bar, 50 μm. (c) Scattergram of the total lengths of the axon and dendrites from each neuron expressing the designated plasmid(s). Dendrites and axons of SEPT7-depleted neurons (S7KD, red) were significantly and proportionally shorter than control neurons (black) whose average±2 s.e.m. is indicated as grey zones. The SEPT7-depletion phenotype was rescued by the co-expression of an RNAi-resistant mRNA encoding mCherry-SEPT7 (S7KD+S7res, closed circles). (n=45 × 3. ***P<0.001; NS, P>0.05 by one-way ANOVA with post hoc Tukey). Error bars denote s.e.m. (d) Significant differences in the tip numbers of axons and dendrites between the experimental groups (n=45 × 3. ***P<0.001 by one-way ANOVA with post hoc Tukey), which were rescued as noted above. Error bars denote s.e.m. (e) Experiment comparable with (a), but using Sept7fl/fl embryo and Myc-Cre plasmid. Immunoblot estimation of the gross efficiency (including the untransfected population) of SEPT7 depletion after gene disruption (div2). See legend in (a). Error bars denote s.e.m. (f) Representative images for the morphometry of GFP/Cre-positive, Sept7+/+/wild type (WT) and Sept7fl/fl (SEPT7KO) pyramidal-like neurons. See legend in (b). (g) Scattergram of the total lengths of the axon and dendrites from each neuron with designated genotype ±Cre expression. Dendrites and axons of Sept7fl/fl +Cre (SEPT7KO, blue circles) neurons were significantly and proportionally shorter than those of control Sept7fl/fl −Cre (orange circles) neurons and Sept7+/+ +Cre (open circles) neurons whose average±2s.e.m. is indicated as grey zones. Statistical analysis showed that acute Sept7 disruption significantly and proportionally shortened their dendrites and axons. (n=30, 15, 30. ***P<0.001 by one-way ANOVA with post hoc Tukey). Note that the short dendrite/axon phenotype elicited by gene disruption was more severe than elicited by RNAi in (c). Error bars denote s.e.m. (h) The tip numbers of axons and dendrites were significantly reduced after Sept7 disruption. (n=30, 15, 30. ***P<0.001 by one-way ANOVA with post hoc Tukey). Error bars denote s.e.m.
Figure 3
Figure 3. Depletion of SEPT7 causes significant accumulation of acetylated α-tubulin in vivoand in vitro.
(a) (top) Coronal section of P15 brain depicting two subcellular segments of layer II/III pyramidal neurons in S1/S2 (modified from Fig. 1c). (bottom) FACS-sorted GFP-positive cerebrocortical neurons electroporated in utero at E15 and collected at P2 (Supplementary Fig. S2) were immunoblotted for total and acetylated α-tubulin. Depletion of SEPT7 by RNAi caused significant acetylation of α-tubulin. (Triplicated experiments. ***P<0.001 by t-test). Error bars denote s.e.m. (b,c) Image-based quantification of acetylated α-tubulin in the somata and dendrites and the axon bundle proximal to the corpus callosum. (top) Representative immunofluorescence images of acetylated α-tubulin in the somata/dendrites (b) and in the axon bundle (c) of GFP-positive S1/S2 pyramidal neurons with or without SEPT7 depletion via RNAi (#1) or gene disruption. In SEPT7-depleted neurons, microtubules were significantly acetylated in the somata/dendrites and in the axons to a lesser extent. Scale bars, 500 μm (b), 200 μm (c). Graphs: Acetylated α-tubulin/GFP immunofluorescence ratio in vivo via RNAi (S7KD#1 and #2) or gene disruption (S7KO). All three modes of SEPT7 depletion consistently caused significant acetylation of α-tubulin in the somata/dendrites and in the axons to a lesser extent. (KD; n=12, 6, 6. ***P<0.001 by one-way ANOVA with post hoc Tukey. KO; n=3, ***P<0.001, *P<0.05 by t-test). Error bars denote s.e.m. (d,e) Immunoblot estimation of the gross acetylated/total α-tubulin ratio (including GFP-negative untransfected population) in SEPT7-depleted cerebrocortical neurons via RNAi (#1, KD) or gene disruption (KO) at div2. Note that α-tubulin was hyperacetylated in SEPT7-depleted neurons. (Triplicated experiments. *P<0.05, **P<0.001 by t-test). Error bars denote s.e.m. (f) (top) Representative immunofluorescence images of acetylated α-tubulin in pyramidal-like cerebrocortical neurons in culture (div2). The insets show GFP co-expressed with shSept7(#1) or the empty vector. The signals for acetylated α-tubulin were elevated in the soma, dendrites and axons of SEPT7-depleted neurons (SEPT7 KD). Scale bars, 50 μm. (bottom) Quantification of acetylated α-tubulin immunofluorescence measured separately in dendrites and axons, showing that SEPT7 depletion caused hyperacetylation of microtubules in axons and dendrites to a comparable degree. (n=12, ***P<0.001, **P<0.01 by t-test). Error bars denote s.e.m.
Figure 4
Figure 4. Stagnant microtubule growth in SEPT7-depleted cerebrocortical neurons.
(a) Representative frames from time-lapse images of GFP-EB1 (cyan), a microtubule plus end tracker, expressed in cerebrocoritical pyramidal-like neurons at div3 (1 day after plating) with or without SEPT7 depletion via RNAi (#1). Each image shows a part of a transfected neuron expressing mCherry whose longest neurite (presumed axon) extends rightward from the soma. Scale bar, 10 μm. (b) Kymographic representation of the anterograde motility of GFP-EB1 puncta. Time-lapse serial images of GFP-EB1 in an axon segment (boxed in a) are stacked. The slope of the trajectory represents the velocity of each GFP-EB1 punctum. Scale bar, 5 μm. (c,d) Anterograde velocity of GFP-EB1 puncta measured in the longest neurites, with or without SEPT7 depletion, and shown as a scattergram (c) and as cumulative curves (d). SEPT7 depletion (S7KD, red) reduced the fast-moving population and shifted the curve to the left. The velocity was measured for 217 (Ctrl) and 188 (S7KD) GFP-EB1 puncta that were tracked for more than 10 s, respectively in 18 and 16 mCherry-expressing neurons that were morphologically comparable. (***P<0.001 by t-test in (c) and by the Kolmogorov–Smirnov test in (d)).
Figure 5
Figure 5. Physiological and direct interaction between septins and the major tubulin deacetylase HDAC6.
(a,b) Immunoblot for endogenous HDAC6 (a) in newborn (P0) and adult cerebral cortex and (b) in primary cerebrocortical neurons at div2 and 3. Each lane respectively contained 50/10 μg total protein. (c) Mutual co-immunoprecipitation of endogenous SEPT7 and HDAC6. Lysates from div2 cerebrocortical neurons were incubated with protein A beads coated with nonimmune IgG, anti-SEPT7 antibody or anti-HDAC6 antibody, and these proteins were detected by immunoblot in a reciprocal manner. (d) Co-expression and mutual co-immunoprecipitation of GFP-SEPT7 and Flag-HDAC6 in heterologous cells. (Left) Anti-Flag antibody detected Flag-HDAC6 (and gave nonspecific faint bands in the 1st and 3rd lanes) and anti-GFP antibody detected GFP and GFP-SEPT7. (Right) When Flag- HDAC6 was captured on anti-Flag beads, GFP-SEPT7 was co-immunoprecipitated, but GFP was not (compare the 2nd and 4th lanes. *, IgG light chain). (e) Direct binding between the purified, recombinant septin complex and HDAC6 in vitro. Immobilized His-tagged SEPT7/6/2 captured GST-HDAC6 but not GST alone. (Coomassie blue staining). (f) Representative results of in situ proximity ligation assay for endogenous SEPT7 and HDAC6 in div2 cerebrocortical neurons. Fluorescent puncta were generated in the somata and neurites only when anti-SEPT7 antibodies and anti-HDAC6 antibodies were present in close proximity. Scale bars, 25 μm. (g) Immunoblot showing that SEPT7 depletion did not affect the amount of HDAC6 in div2 cerebrocortical neurons. (Triplicated experiment. NS, P>0.05 by t-test). Error bars denote s.e.m. (h) SEPT7 depletion via RNAi (#1, S7KD) did not alter the deacetylating activity of HDAC6. Cell lysates as in (b) were subjected to an in vitro assay with a fluorogenic substrate. (Triplicated experiment. NS, P>0.05 by t-test). Error bars denote s.e.m. (i) SEPT7 depletion via RNAi (#1, S7KD) caused dissociation of HDAC6 and acetylated α-tubulin. (Left) Cell lysates as in (b,h) were immunoblotted for endogenous HDAC6, acetylated α-tubulin and total α-tubulin. Hyperacetylation of α-tubulin in SEPT7-depleted neurons was recapitulated (cf. Fig. 3d). Each lane contained 50 μg total protein. (Right) Although SEPT7 depletion increased acetylated α-tubulin, its association with HDAC6 was paradoxically reduced. (Triplicated experiments. *P<0.05, **P<0.01 by t-test). Error bars denote s.e.m.
Figure 6
Figure 6. Direct inhibition of HDAC6 by tubacin gives a phenocopy of SEPT7 depletion.
(a) (Top panels) Representative images of GFP-expressing cerebrocortical neurons at div2 treated with vehicle alone (0.1% DMSO) or with 10 μM tubacin in vehicle. HDAC6 inhibition by tubacin inhibited the growth of both dendrites and axons. (Bottom panels) SEPT7 depletion via RNAi (#1) combined with tubacin treatment did not exhibit an obvious additive effect on neurite morphology. Scale bar, 50 μm. (b) Scattergram of total dendrite length and total axon length of pyramidal-like cerebrocortical neurons treated with tubacin and SEPT7-depletion in the four combinations shown in (a). The growth of both dendrites and axons was markedly inhibited by tubacin treatment (black closed circles) in comparison with the control (black open circles), which was not enhanced by additional depletion of SEPT7 (red closed circles). (c) Statistical analysis of the results shown in (b) with plots of the mean values, showing that tubacin treatment significantly and proportionally shortened dendrites and axons. The neurite-shortening effect of tubacin was more potent than, and not enhanced by, SEPT7 depletion. The grey bars represent average±2 s.e.m. of the control samples. (n=45 × 4. ***P<0.001 by one-way ANOVA with post hoc Tukey). Error bars denote s.e.m. (d and e) Tip numbers of axons and dendrites in the above samples were significantly reduced by tubacin alone, by SEPT7 depletion alone, or by the combination of the two. (n=45 × 4. ***P<0.001 by one-way ANOVA with post hoc Tukey). Error bars denote s.e.m.
Figure 7
Figure 7. Schematic diagram illustrating the involvement of the HDAC6-septin association in microtubule deacetylation and axon/dendrite growth.
HDAC6 is the major microtubule deacetylase, which promotes microtubule remodelling by counteracting acetyl transferases that stabilize microtubules. This study demonstrated that the direct interaction with the septin complex facilitates the access of HDAC6 to acetylated α-tubulin and/or stabilizes the enzyme-substrate interaction without altering the deacetylation activity of HDAC6. An open question is whether the putative tripartite interaction of the septin complex/HDAC6/acetylated α-tubulin (a subset of the signals in the PLA assay shown in Fig. 5f should represent this) occurs on α/β-tubulin heterodimers, protofilaments and/or microtubules. It is also worth testing whether an actomyosin-dependent mechanism, including another HDAC6 substrate cortactin, could contribute to the stagnant neurite growth after septin depletion. Independent of the specific underlying mechanism, the novel molecular network identified in this study has shed new light on the common machinery for the growth of axons and dendrites in vivo and in vitro.

References

    1. Mitchison T. & Kirschner M. Cytoskeletal dynamics and nerve growth. Neuron 1, 761–772 (1988). - PubMed
    1. Conde C. & Caceres A. Microtubule assembly, organization and dynamics in axons and dendrites. Nat. Rev. Neurosci. 10, 319–332 (2009). - PubMed
    1. Sulston J. E. & Horvitz H. R. Abnormal cell lineages in mutants of the nematode Caenorhabditis elegans. Dev. Biol. 82, 41–55 (1981). - PubMed
    1. White J. G., Horvitz H. R. & Sulston J. E. Neurone differentiation in cell lineage mutants of Caenorhabditis elegans. Nature 297, 584–587 (1982). - PubMed
    1. Sakamoto T. et al. Mass spectrometric analysis of microtubule co-sedimented proteins from rat brain. Genes Cells 13, 295–312 (2008). - PubMed

Publication types

MeSH terms