

Effects of fat on MR-measured metabolite signal strengths: implications for in vivo MRS studies of the human brain
- PMID: 24115006
- PMCID: PMC4103156
- DOI: 10.1002/nbm.3016
Effects of fat on MR-measured metabolite signal strengths: implications for in vivo MRS studies of the human brain
Abstract
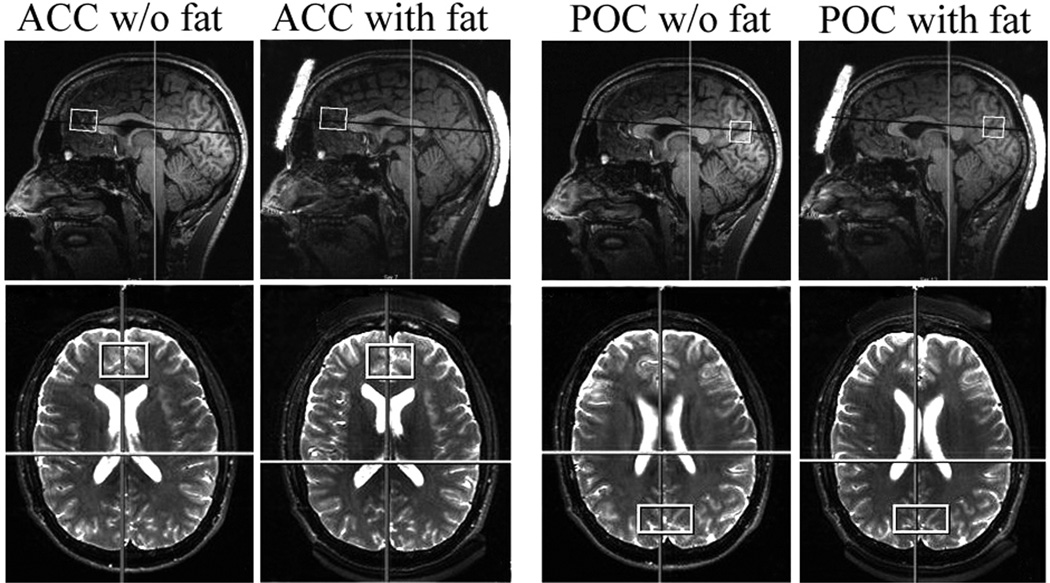
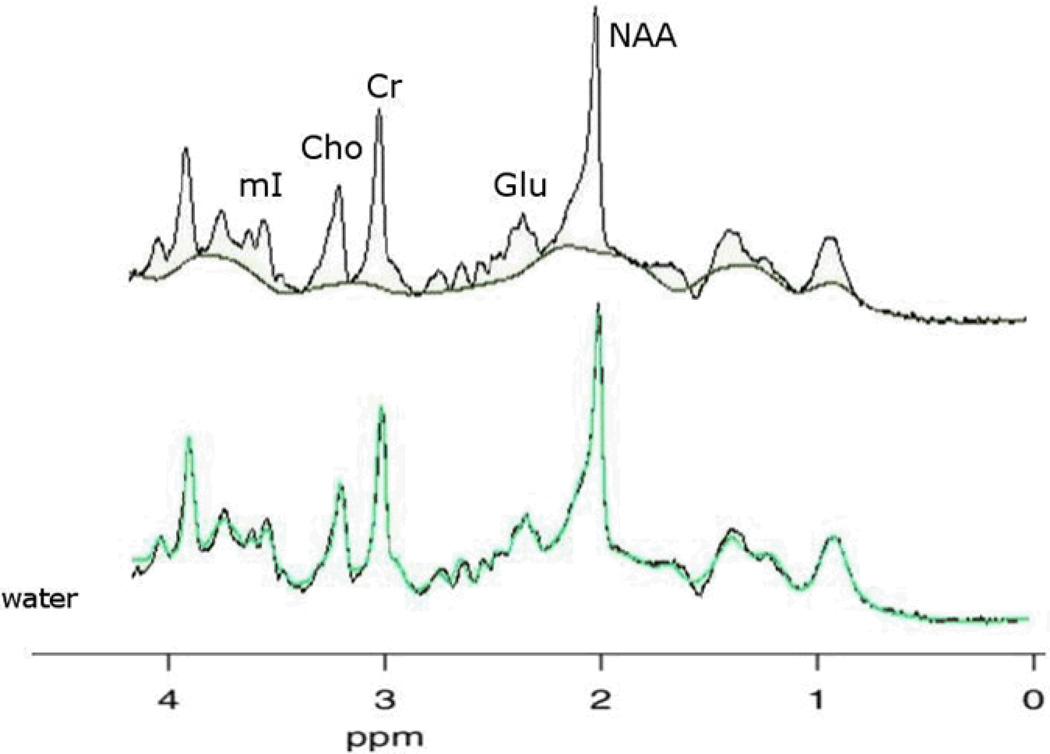
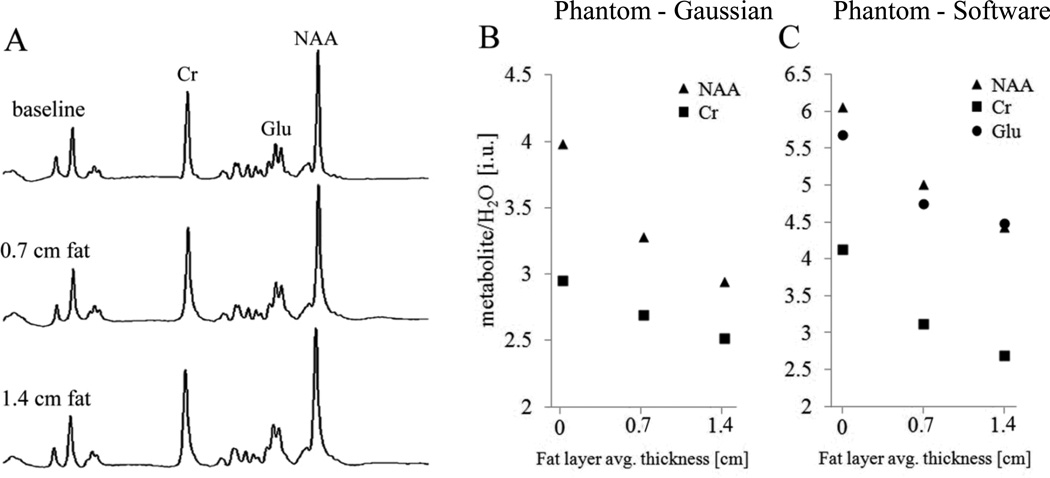
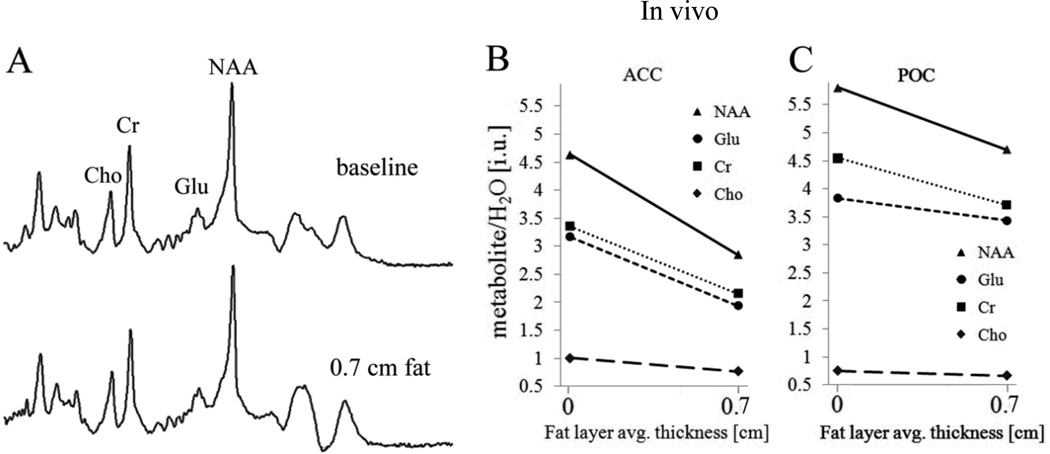
Recent MRS studies have indicated that a higher body mass index (BMI) is associated with lower brain metabolite levels. Generally, individuals with higher BMIs have more body fat deposits than individuals with normal BMIs. This single-voxel spectroscopy (SVS) study investigated possible effects of fat on MR-measured metabolite signal areas, which may at least partly explain the observed associations of BMI with MR-measured brain metabolite levels in vivo. SVS data were acquired at 4 T from a phantom containing N-acetylaspartate, glutamate and creatine, as well as from three healthy male adults. Back fat obtained from pig was used to assess the effects of fat on metabolite signals. With the same voxel size and placement, the phantom was first scanned without fat (baseline), and then with 0.7-cm- and 1.4-cm-thick fat layers placed on it. Each participant was also scanned first without fat and then with two 0.7-cm fat layers, one placed beneath the occiput and the other on the forehead. Two spectra were acquired per participant from the anterior cingulate and the parieto-occipital cortices. The metabolite resonance and corresponding water peak areas were then fitted and metabolite to water signal ratios were used for analyses. In both phantom and in vivo experiments, the metabolite-to-water ratios decreased in the presence of fat relative to baseline metabolite-to-water ratios. The reduced metabolite signals in the presence of fat reported here are reminiscent of the negative correlations observed between BMI and MR-measured metabolite levels. These apparent physical effects of fat have potentially far-reaching consequences for the accuracy of MR measurements of brain metabolite levels and their interpretation, particularly when large fat stores exist around the skull, such as in individuals with higher BMI.
Keywords: MRS; body fat; body mass index; dielectric effects; metabolite concentration; radiofrequency absorption.
Copyright © 2013 John Wiley & Sons, Ltd.
Figures
Similar articles
-
Quantitative 1H MRS of the human brain in vivo based on the stimulation phantom calibration strategy.Magn Reson Med. 1998 Mar;39(3):491-6. doi: 10.1002/mrm.1910390320. Magn Reson Med. 1998. PMID: 9498606
-
Brain glutamate in anorexia nervosa: a magnetic resonance spectroscopy case control study at 7 Tesla.Psychopharmacology (Berl). 2017 Feb;234(3):421-426. doi: 10.1007/s00213-016-4477-5. Epub 2016 Dec 1. Psychopharmacology (Berl). 2017. PMID: 27909746 Free PMC article.
-
Serial precision of metabolite peak area ratios and water referenced metabolite peak areas in proton MR spectroscopy of the human brain.Magn Reson Imaging. 1998 Apr;16(3):319-30. doi: 10.1016/s0730-725x(97)00280-4. Magn Reson Imaging. 1998. PMID: 9621973
-
Potential clinical impact of multiparametric quantitative MR spectroscopy in neurological disorders: A review and analysis.Magn Reson Med. 2020 Jan;83(1):22-44. doi: 10.1002/mrm.27912. Epub 2019 Aug 8. Magn Reson Med. 2020. PMID: 31393032 Free PMC article. Review.
-
The principles of quantification applied to in vivo proton MR spectroscopy.Eur J Radiol. 2008 Aug;67(2):218-229. doi: 10.1016/j.ejrad.2008.02.034. Epub 2008 Apr 22. Eur J Radiol. 2008. PMID: 18434059 Review.
Cited by
-
Abdominal obesity and white matter microstructure in midlife.Hum Brain Mapp. 2017 Jul;38(7):3337-3344. doi: 10.1002/hbm.23576. Epub 2017 Apr 8. Hum Brain Mapp. 2017. PMID: 28390146 Free PMC article.
-
Fat may affect magnetic resonance signal intensity and brain tissue volumes.Obes Res Clin Pract. 2016 Mar-Apr;10(2):211-5. doi: 10.1016/j.orcp.2015.07.009. Epub 2015 Aug 7. Obes Res Clin Pract. 2016. PMID: 26259685 Free PMC article.
-
Inverse Association Between Hypothalamic N-Acetyl Aspartate/Creatine Ratio and Indices of Body Mass in Adolescents with Obesity.J Nutr. 2022 Mar 3;152(3):663-670. doi: 10.1093/jn/nxab415. J Nutr. 2022. PMID: 34888674 Free PMC article.
References
-
- Ajilore O, Haroon E, Kumaran S, Darwin C, Binesh N, Mintz J, Miller J, Thomas MA, Kumar A. Measurement of brain metabolites in patients with type 2 diabetes and major depression using proton magnetic resonance spectroscopy. Neuropsychopharmacology. 2007;32:1224–1231. - PubMed
-
- Bertolino A, Nawroz S, Mattay VS, Barnett AS, Duyn JH, Moonen CT, Frank JA, Tedeschi G, Weinberger DR. Regionally specific pattern of neurochemical pathology in schizophrenia as assessed by multislice proton magnetic resonance spectroscopic imaging. Am J Psychiatry. 1996;153:1554–1563. - PubMed
-
- Bertolino A, Callicott JH, Nawroz S, Mattay VS, Duyn JH, Tedeschi G, Frank JA, Weinberger DR. Reproducibility of proton magnetic resonance spectroscopic imaging in patients with schizophrenia. Neuropsychopharmacology. 1998;18:1–9. - PubMed
Publication types
MeSH terms
Substances
Grants and funding
LinkOut - more resources
Full Text Sources
Other Literature Sources
