Fluorescence spectroscopy of soluble E. coli SPase I Δ2-75 reveals conformational changes in response to ligand binding
- PMID: 24115229
- PMCID: PMC3949126
- DOI: 10.1002/prot.24429
Fluorescence spectroscopy of soluble E. coli SPase I Δ2-75 reveals conformational changes in response to ligand binding
Abstract
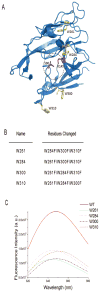
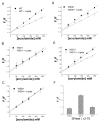
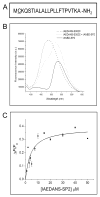
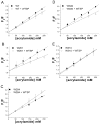
The bacterial Sec pathway is responsible for the translocation of secretory preproteins. During the later stages of transport, the membrane-embedded signal peptidase I (SPase I) cleaves the signal peptide from a preprotein. We used tryptophan fluorescence spectroscopy of a soluble, catalytically active E. coli SPase I Δ2-75 enzyme to study its dynamic conformational changes while in solution and when interacting with lipids and signal peptides. We generated four single Trp SPase I Δ2-75 mutants, W261, W284, W300, and W310. Based on fluorescence quenching experiments, W300 and W310 were found to be more solvent accessible than W261 and W284 in the absence of ligands. W300 and W310 inserted into lipids, consistent with their location at the enzyme's proposed membrane-interface region, while the solvent accessibilities of W261, W284, and W300 were modified in the presence of signal peptide, suggesting propagation of structural changes beyond the active site in response to peptide binding. The signal peptide binding affinity for the enzyme was measured via FRET experiments and the Kd determined to be 4.4 μM. The location of the peptide with respect to the enzyme was also established; this positioning is crucial for the peptide to gain access to the enzyme active site as it emerges from the translocon into the membrane bilayer. These studies reveal enzymatic structural changes required for preprotein proteolysis as it interacts with its two key partners, the signal peptide and membrane phospholipids.
Keywords: acrylamide quenching; preprotein cleavage; protein transport; signal peptidase; signal peptide.
Copyright © 2013 Wiley Periodicals, Inc.
Figures


Similar articles
-
Structural studies of a signal peptide in complex with signal peptidase I cytoplasmic domain: the stabilizing effect of membrane-mimetics on the acquired fold.Proteins. 2012 Mar;80(3):807-17. doi: 10.1002/prot.23238. Epub 2011 Nov 24. Proteins. 2012. PMID: 22113858 Free PMC article.
-
A small subset of signal peptidase residues are perturbed by signal peptide binding.Chem Biol Drug Des. 2008 Aug;72(2):140-6. doi: 10.1111/j.1747-0285.2008.00685.x. Epub 2008 Jul 15. Chem Biol Drug Des. 2008. PMID: 18637988 Free PMC article.
-
Structure and mechanism of Escherichia coli type I signal peptidase.Biochim Biophys Acta. 2014 Aug;1843(8):1497-508. doi: 10.1016/j.bbamcr.2013.12.003. Epub 2013 Dec 11. Biochim Biophys Acta. 2014. PMID: 24333859 Review.
-
Lipid and signal peptide-induced conformational changes within the C-domain of Escherichia coli SecA protein.Biochemistry. 2001 Feb 13;40(6):1835-43. doi: 10.1021/bi002058w. Biochemistry. 2001. PMID: 11327846
-
Signal peptidase I: cleaving the way to mature proteins.Protein Sci. 2012 Jan;21(1):13-25. doi: 10.1002/pro.757. Epub 2011 Nov 22. Protein Sci. 2012. PMID: 22031009 Free PMC article. Review.
Cited by
-
The Stories Tryptophans Tell: Exploring Protein Dynamics of Heptosyltransferase I from Escherichia coli.Biochemistry. 2017 Feb 14;56(6):886-895. doi: 10.1021/acs.biochem.6b00850. Epub 2017 Jan 30. Biochemistry. 2017. PMID: 28098447 Free PMC article.
-
Membrane Chaperoning of a Thylakoid Protease Whose Structural Stability Is Modified by the Protonmotive Force.Plant Cell. 2020 May;32(5):1589-1609. doi: 10.1105/tpc.19.00797. Epub 2020 Mar 13. Plant Cell. 2020. PMID: 32169961 Free PMC article.
-
The Glycosyltransferases of LPS Core: A Review of Four Heptosyltransferase Enzymes in Context.Int J Mol Sci. 2017 Oct 27;18(11):2256. doi: 10.3390/ijms18112256. Int J Mol Sci. 2017. PMID: 29077008 Free PMC article. Review.
-
Opposites Attract: Escherichia coli Heptosyltransferase I Conformational Changes Induced by Interactions between the Substrate and Positively Charged Residues.Biochemistry. 2020 Sep 1;59(34):3135-3147. doi: 10.1021/acs.biochem.9b01005. Epub 2020 Feb 10. Biochemistry. 2020. PMID: 32011131 Free PMC article.
References
-
- Driessen AJ, Nouwen N. Protein translocation across the bacterial cytoplasmic membrane. Annu Rev Biochem. 2008;77:643–667. - PubMed
-
- Taheri T, Salmanian AH, Gholami E, Doustdari F, Zahedifard F, Rafati S. Leishmania major: disruption of signal peptidase type I and its consequences on survival, growth and infectivity. Exp Parasitol. 2010;126(2):135–145. - PubMed
-
- Paetzel M, Karla A, Strynadka NC, Dalbey RE. Signal peptidases. Chem Rev. 2002;102(12):4549–4580. - PubMed
Publication types
MeSH terms
Substances
Grants and funding
LinkOut - more resources
Full Text Sources
Other Literature Sources
Molecular Biology Databases

