. 2013 Dec;61(12):2009-22.
doi: 10.1002/glia.22572. Epub 2013 Sep 24.

Lysophosphatidic acid (LPA) and its receptor, LPA1 , influence embryonic schwann cell migration, myelination, and cell-to-axon segregation

Affiliations

Lysophosphatidic acid (LPA) and its receptor, LPA1 , influence embryonic schwann cell migration, myelination, and cell-to-axon segregation

Brigitte Anliker et al. Glia. 2013 Dec.

Abstract

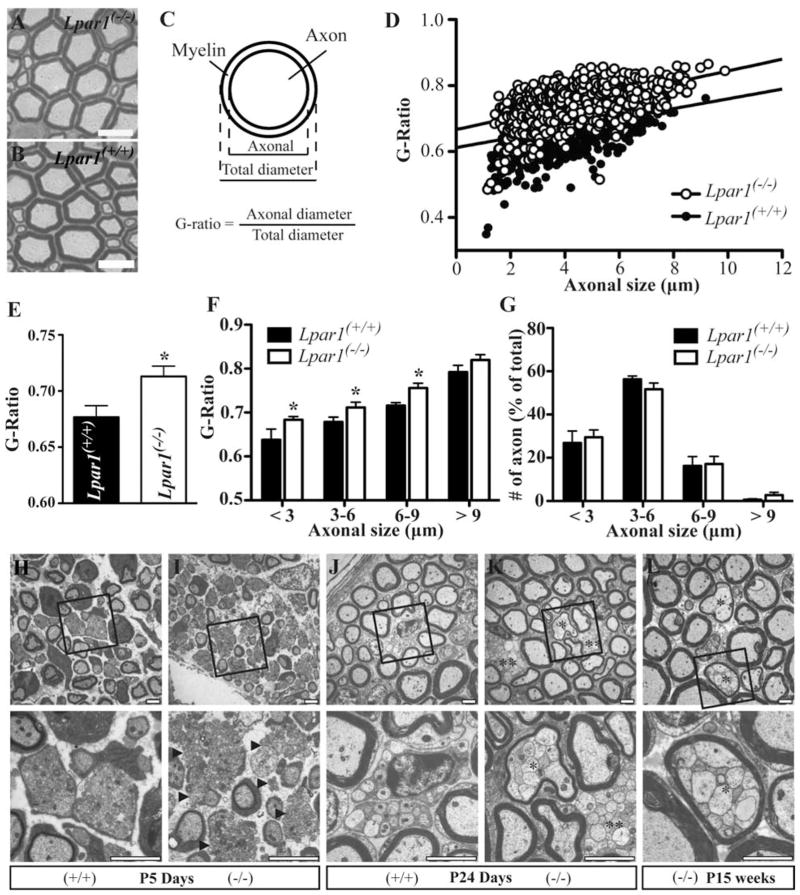
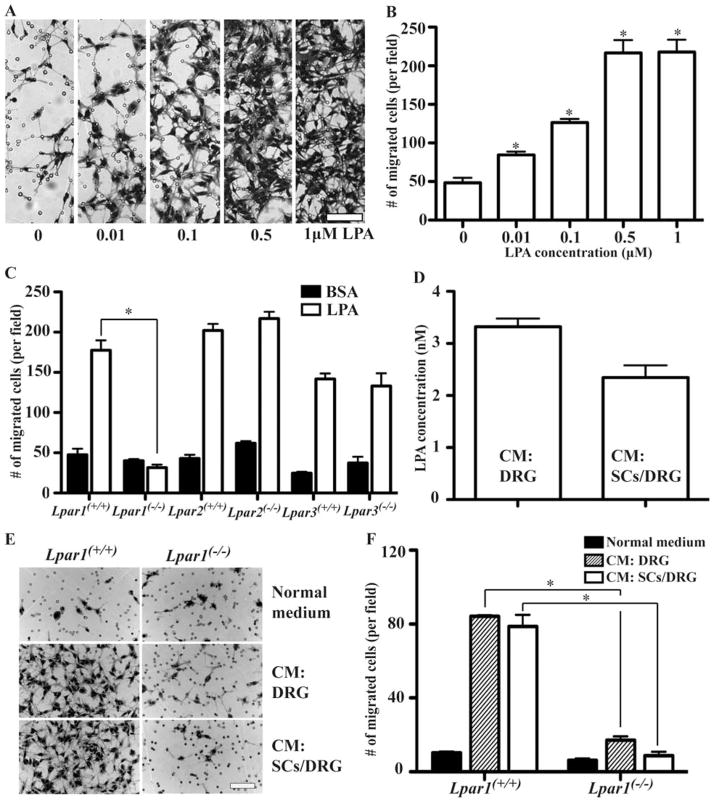
Schwann cell (SC) migration is an important step preceding myelination and remyelination in the peripheral nervous system, and can be promoted by peptide factors like neuregulins. Here we present evidence that a lipid factor, lysophosphatidic acid (LPA), influences both SC migration and peripheral myelination through its cognate G protein-coupled receptor (GPCR) known as LPA1 . Ultrastructural analyses of peripheral nerves in mouse null-mutants for LPA1 showed delayed SC-to-axon segregation, polyaxonal myelination by single SCs, and thinner myelin sheaths. In primary cultures, LPA promoted SC migration through LPA1 , while analysis of conditioned media from purified dorsal root ganglia neurons using HPLC/MS supported the production of LPA by these neurons. The heterotrimeric G-alpha protein, Gαi , and the small GTPase, Rac1, were identified as important downstream signaling components of LPA1 . These results identify receptor mediated LPA signaling between neurons and SCs that promote SC migration and contribute to the normal development of peripheral nerves through effects on SC-axon segregation and myelination.

Keywords: Gi; LPA; Rac1; Schwann cell; myelination.


Figures

FIGURE 1
FIGURE 1
Deletion of LPA1 in mice produces myelination and axonal segregation defects. A–G, Semi-thin cross sections (2 μm) of sciatic nerves from adult WT (Lpar1(+/+), n = 5) and LPA1 null mice (Lpar1(/), n = 7) stained for myelin. Representative pictures of a sciatic nerve from adult LPA1 null (A) and WT (B) mice are shown. C, Schematic diagram of g-ratio. D, G-ratio of individual fibers from two mice per group shown in a scatter plot. E, The mean g-ratio value was calculated from all nerves processed (mean ± SEM. * P < 0.05 vs. WT, t-test). F, Mean g-ratio values from all WT and LPA1 null mice were calculated and grouped according to axonal diameter (means ± SEM * P <0.05 vs. WT, t-test). G, The percentage of axons in sciatic nerves, as determined by axonal diameter, is equivalent in WT and LPA1 null mice. H–L, Sciatic nerves from WT (H, J) and LPA1 null (I, K, L) littermate mice were isolated at different ages and processed for electron microscopy. Representative pictures from sciatic nerves at postnatal day 5 (P5) (H, I), postnatal day 24 (P24) (J, K), and at 15 weeks of age (15 weeks) are shown (L). Arrowheads indicate naked axon bundles (I); *polyaxonal myelination of small caliber axons (K,L); **axon bundles that are not ensheathed by SCs (K). (+/+) and (/) represent WT and LPA1 null mice, respectively. Scale bars, 10 μm (A, B), 2 μm (H–L).
FIGURE 2
FIGURE 2
Myelination capability and expression levels of other LPA receptors are not affected in LPA1 null Schwann cells. A–C, In vitro myelination analysis using purified E13.5 Schwann cells and DRG neurons. WT (A) and LPA1 null (B) SCs were added to purified WT DRG neurons and myelination was induced by addition of ascorbic acid for 2 weeks. Myelin sheaths were visualized by immunostaining using an antibody against myelin basic protein (MBP). Scale bar, 100 μm (A, B). MBP positive segments were quantified at five fields per coverslip. (Mean ± SD, n = 4). (C). D, E, mRNA expression levels of LPA1–6, NRG1 Type III, and ErbB2 in purified E13.5 SC (D) and DRG neurons (E) were examined using qPCR (normalized to β-Actin, n = 3, mean ± SD, * P < 0.05, t-test).
FIGURE 3
FIGURE 3
LPA produced by neuronal cells mediates SC migration through LPA1. A and B, Increasing concentrations of LPA added to the lower compartments of transwell chambers induced SC migration across a membrane with an 8 μm pore size. SCs that migrated to the bottom side of the membrane after 5 to 6 h were stained with crystal violet (A) and quantified (B). Shown are mean ± SEM. (n = 5, *P < 0.05 vs. control (0.1% BSA), t-test) (B). C, Comparison of migration of WT and LPA1/2/3 null SCs toward LPA. Mean ± SEM of one representative example of four independent experiments (n = 3, *P < 0.05 vs. basal migration under control conditions, t-test). D, LPA concentration in the conditioned medium from purified DRG neurons (CM: DRG) or DRG neuron/SC co-cultures (CM: SCs/DRG) as measured by HPLC/MS. mean ± SEM (n = 6). E, F, Transwell migration of WT and LPA1 null SCs in response to control or conditioned media from purified DRG neurons (CM: DRG) or DRG neuron/SC co-cultures (CM: SCs/DRG). Representative photographs are shown after 5 to 6 h of migration (E), the number of SCs that migrated to the bottom side of the transwells was quantified (F). Mean ± SEM of a representative example of four independent experiments (n = 3, *P < 0.05 vs. same treatment in WT group, t-test). Scale bar, 100 μm (A, E).
FIGURE 4
FIGURE 4
LPA induces SC migration along purified DRG neurons through LPA1. A–L, Aggregated WT (A–F) or LPA1-null SCs (G–L) expressing a GFP transgene were added to purified DRG neuronal cultures and incubated in the presence of vehicle (0.1% BSA, A, B, C, G, H, I) or 1 μM LPA (D, E, F, J, K, L) for 6 to 7 h. DAPI staining shows the nuclei of SCs and neurons (A, D, G, J). In addition, SCs were detected via GFP fluorescence (B, E, H, K), and DRG neurons were stained for neurofilaments to visualize axons (red in C, F, I, L). Merged images are also shown (C, F, I, L). Some of the neuronal cell soma are indicated with asterisks (I). Scale bar, 100 μm. M, LPA-induced migration from the aggregates along the fasciculated DRG axons was quantified by measuring the average distance of migrated SCs from the periphery of the aggregates. (Arrowhead, D, E, F) Mean ± SEM of a representative example of three independent experiments (n = 8, **P = 0.0028, ***P = 0.0003, vs. migration of WT cells under control conditions, t-test).
FIGURE 5
FIGURE 5
Gi proteins and the small GTPase Rac1 are involved in LPA/LPA1 signaling-mediated SC migration. A–C, WT SCs were pretreated overnight with 150 ng/mL pertussis toxin to inhibit Gi proteins (A), or treated for 30 to 45 min with either 100 μM NSC23766 to block Rac1 (B) or 50 μM LY294002 and 100 nM wortmannin to inhibit PI3K (C) before SC migration was induced by adding 500 nM LPA to the lower transwell compartment. After 5 to 6 h, LPA-induced migration was quantified and compared with the vehicle (0.1% BSA)-induced migration of SCs treated with the respective inhibitors and to the responses of untreated SCs (A–C). Fold-increased over vehicle treated cells are presented as mean ± SD of representative examples of two to four independent experiments (n = 3, *P < 0.05, t-test). D, Activation of endogenous Rac1 upon treatment with 1 μM LPA in WT or LPA1 null SCs. GTP-bound Rac1 was pulled down from cell lysates at the indicated time points after addition of 1 μM LPA using a GST-tagged PAK-binding domain. Active GTP-bound and total Rac1 levels were subsequently analyzed by Western blotting. The fold increase of activated Rac1 at the different time points was measured and normalized against the total Rac1 levels. Shown are representative examples of two to three independent experiments. The involvement of MAPKs including ERK1/2, p38, JNKs, and the Rho kinase ROCK was determined using specific inhibitors for each protein. WT SCs were pretreated for 30 min with 50 μM PD98059 (E), 20 μM SB203580 (E), 10 μM SP600129 (F), or 10 μM Y27632 (F) to inhibit the activation of ERK1/2, p38, JNKs, or ROCK before migration was induced by adding 500 nM LPA to the lower transwell compartments. Values represent mean ± SD of representative examples of two independent experiments (E, F).
FIGURE 6
FIGURE 6
Schematic model of LPA/LPA1 signaling in SCs and its effects on SC developmental processes. LPA secreted by DRG neurons increases SC migration through binding to LPA1 and subsequent activation of Gi proteins and the small GTPase Rac1. Removal of LPA1 in vivo results in delayed axonal segregation and aberrant myelination suggesting that LPA/LPA1 signaling either directly or indirectly modulates axonal segregation and myelination. Since binding of LPA and NRG to their receptors LPA1 and ErbB2/ErbB3 can activate similar downstream signaling pathways, as shown for the previously described anti-apoptotic effect in SCs, it is possible that LPA1 modulates activation of downstream effectors of the NRG/ErbB2/ErbB signaling pathways regulating axonal segregation and myelination. Whether other LPA receptors (LPA2,3,4,6) expressed in SC are involved in SC differentiation processes has not been clarified.

References

    1. Allard J, Barron S, Diaz J, Lubetzki C, Zalc B, Schwartz JC, Sokoloff P. A rat G protein-coupled receptor selectively expressed in myelin-forming cells. Eur J Neurosci. 1998;10:1045–1053. - PubMed
    1. Anliker B, Chun J. Lysophospholipid G protein-coupled receptors. J Biol Chem. 2004;279:20555–20558. - PubMed
    1. Anton ES, Weskamp G, Reichardt LF, Matthew WD. Nerve growth factor and its low-affinity receptor promote Schwann cell migration. Proc Natl Acad Sci USA. 1994;91:2795–2799. - PMC - PubMed
    1. Benard V, Bokoch GM. Assay of Cdc42, Rac, and Rho GTPase activation by affinity methods. Methods Enzymol. 2002;345:349–359. - PubMed
    1. Benninger Y, Thurnherr T, Pereira JA, Krause S, Wu X, Chrostek-Grashoff A, Herzog D, Nave KA, Franklin RJ, Meijer D, et al. Essential and distinct roles for cdc42 and rac1 in the regulation of Schwann cell biology during AQ2 peripheral nervous system development. J Cell Biol. 2007;177(6):1051–61. - PMC - PubMed

Publication types

MeSH terms

Substances