. 2013 Oct;10(10):e1001527.
doi: 10.1371/journal.pmed.1001527. Epub 2013 Oct 8.

Assessing optimal target populations for influenza vaccination programmes: an evidence synthesis and modelling study

Affiliations

Assessing optimal target populations for influenza vaccination programmes: an evidence synthesis and modelling study

Marc Baguelin et al. PLoS Med. 2013 Oct.

Abstract

Background: Influenza vaccine policies that maximise health benefit through efficient use of limited resources are needed. Generally, influenza vaccination programmes have targeted individuals 65 y and over and those at risk, according to World Health Organization recommendations. We developed methods to synthesise the multiplicity of surveillance datasets in order to evaluate how changing target populations in the seasonal vaccination programme would affect infection rate and mortality.

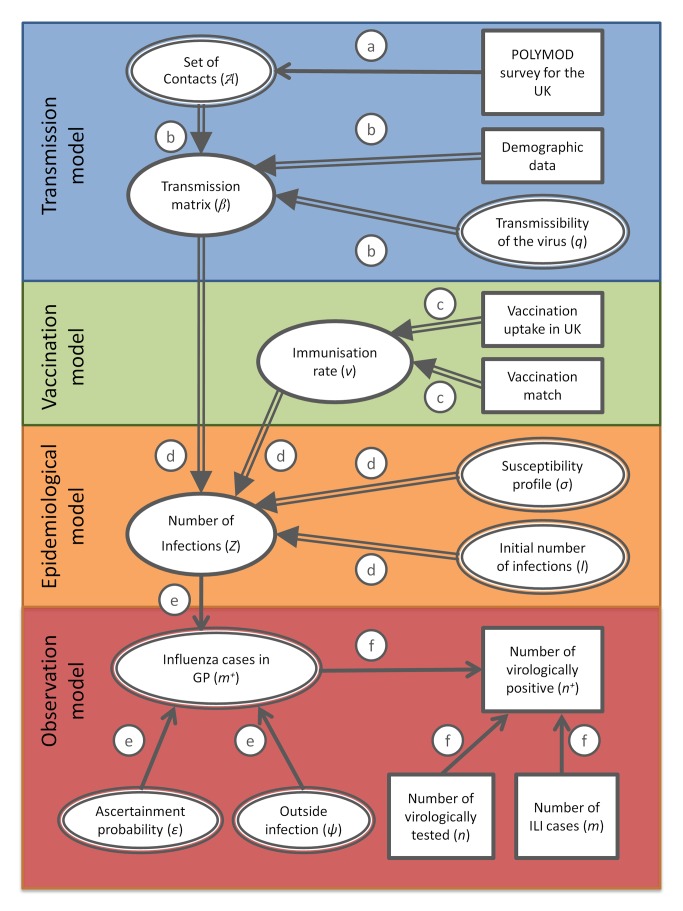
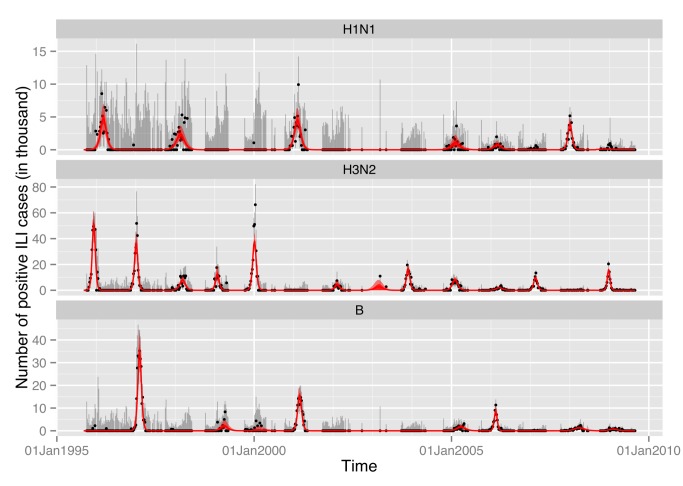
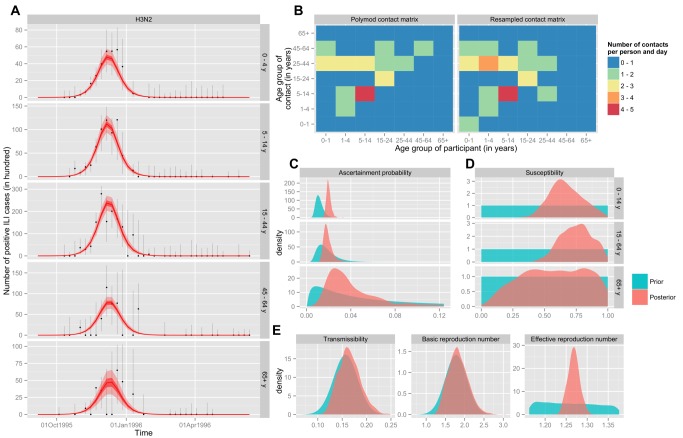
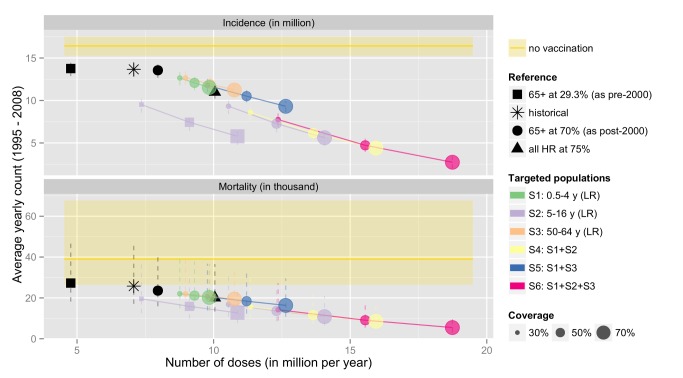
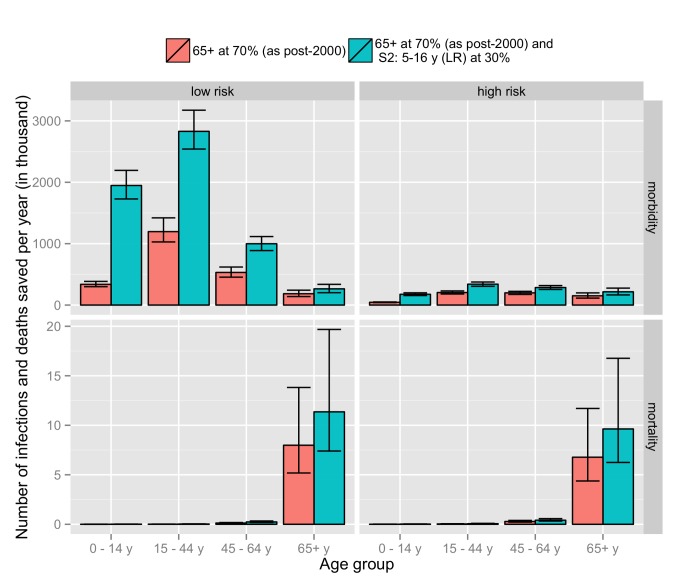
Methods and findings: Using a contemporary evidence-synthesis approach, we use virological, clinical, epidemiological, and behavioural data to develop an age- and risk-stratified transmission model that reproduces the strain-specific behaviour of influenza over 14 seasons in England and Wales, having accounted for the vaccination uptake over this period. We estimate the reduction in infections and deaths achieved by the historical programme compared with no vaccination, and the reduction had different policies been in place over the period. We find that the current programme has averted 0.39 (95% credible interval 0.34-0.45) infections per dose of vaccine and 1.74 (1.16-3.02) deaths per 1,000 doses. Targeting transmitters by extending the current programme to 5-16-y-old children would increase the efficiency of the total programme, resulting in an overall reduction of 0.70 (0.52-0.81) infections per dose and 1.95 (1.28-3.39) deaths per 1,000 doses. In comparison, choosing the next group most at risk (50-64-y-olds) would prevent only 0.43 (0.35-0.52) infections per dose and 1.77 (1.15-3.14) deaths per 1,000 doses.

Conclusions: This study proposes a framework to integrate influenza surveillance data into transmission models. Application to data from England and Wales confirms the role of children as key infection spreaders. The most efficient use of vaccine to reduce overall influenza morbidity and mortality is thus to target children in addition to older adults. Please see later in the article for the Editors' Summary.


Conflict of interest statement

ND is a member of the Editorial Board of PLOS Medicine where he acts as a statistical adviser.

Figures

Figure 1
Figure 1. Directed acyclic graph showing the link between the different modelling components, data, and parameters.
Double and simple arrows indicate, respectively, deterministic and stochastic relationships, ellipses indicate variables, and rectangles indicate data. The circled letters indicate which relationship connects the variables or data involved. These relationships are as follows: process a, drawing with replacement; process b, calculation of the transmission matrix by rescaling the mixing matrix obtained by reweighting for age and weekday and weekend days; process c, derivation of the immunisation rate from uptake data and match of vaccine; process d, integration of the SEIR model of transmission; process e, ascertainment of cases through ILI recording at GPs; process f, virological testing scheme following a hypergeometric distribution.
Figure 2
Figure 2. Venn diagram giving a schematic representation of the different surveillance schemes and clinical statuses.
The relative proportions of the different sets vary from one week to another and are different for each age group.
Figure 3
Figure 3. Reconstructed epidemics for the three seasonal subtypes between September 1995 and September 2009.
The fit of the model is compared to the age-specific time series of positive ILI cases estimated from the data. For the model, the mean (red line) with 95% CIs (shaded areas) is based on the associated binomial process. For the data, we have represented the unbiased estimator (black dots), with the 95% CI based on a hypergeometric distribution (see Text S1).
Figure 4
Figure 4. Inference results for H3N2 during the 1995/1996 season.
(A) Comparison of the fit of the model to the age-specific time series of positive ILI cases estimated from the data. For the model, the mean (red line) with 50% and 95% CIs (light and dark shaded areas, respectively) is based on the associated binomial process. For the data, we have represented the unbiased estimator (black dots), with the 95% CI associated with the hypergeometric distribution (error bars). (B) Comparison of the contact matrix of the POLYMOD study (left panel) to the resampled matrix of the maximum likelihood MCMC sample (right panel). (C) Age-specific probability of being recorded as ILI and positive if tested and infected. (D) Age-specific susceptibility at the beginning of the flu season. (E) Transmission coefficient (q, left panel) and derived quantities: basic (R 0, middle panel) and effective (Re(t = 0), right panel) reproduction numbers. For (C–E): the prior distribution is shown in blue, and the posterior distribution in red.
Figure 5
Figure 5. Values (posterior distributions) of the specific reproductive numbers for children (R C) and adults (R A) during the study period for all strains present at an epidemic level during the season.
Epidemics are defined as including at least 1R C and R A = 1, respectively. The diagonal dotted line is R C = R A.
Figure 6
Figure 6. Estimated number of influenza cases and deaths occurring over the 14-y period under the actual vaccination programme, and a series of alternatives.
The horizontal axis gives the size (number of doses given) of each of the alternative vaccination programmes (S1 to S6—defined as incremental on the current programme). HR and LR refer to the high-risk and low-risk groups, respectively. The black square represents the estimate of what would have happened if England and Wales had maintained its risk-group-specific vaccination programme throughout the period. The black circle represents what would have happened if the post-2000 programme (targeting vaccination to high-risk and elderly individuals) had been in place throughout the period. The actual vaccination programme is given by the asterisk. Coloured circles represent additions to the current strategy (i.e., extending vaccination to low-risk non-elderly individuals), and coloured squares represent alternative extensions to the pre-2000 programme (i.e., if instead of extending vaccination to low-risk elderly individuals, vaccination had been offered to low-risk individuals in other age groups). The size of the coloured circles and squares represents the assumed coverage achieved, and the different colours represent which age groups are targeted.
Figure 7
Figure 7. Comparison of the number of cases saved per year for the current strategy (vaccination of high-risk and 65+-y individuals) with an extension of the current strategy that additionally targets the 5–16-y age group.
Results are shown for number of infections (morbidity) and deaths (mortality) by age and risk group.

References

    1. Hardelid P, Pebody R, Andrews N (2012) Mortality caused by influenza and respiratory syncytial virus by age group in England and Wales 1999–2010. Influenza Other Respi Viruses 7: 35–45. - PMC - PubMed
    1. Mauskopf J, Klesse M, Lee S, Herrera-Taracena G (2012) The burden of influenza complications in different high-risk groups: a targeted literature review. J Med Econ 16: 264–277. - PubMed
    1. World Health Organization (2005) Influenza vaccines—WHO position paper. Wkly Epidemiol Rec 33: 279–287 Available: http://www.who.int/immunization/wer8033influenza_August2005_position_pap.... Accessed 5 September 2013.
    1. World Health Organization (2012) Vaccines against influenza—WHO position paper. Wkly Epidemiol Rec 87: 461–476. - PubMed
    1. Viboud C, Boëlle P-Y, Cauchemez S, Lavenu A, Valleron A-J, et al. (2004) Risk factors of influenza transmission in households. Br J Gen Pract 54: 684–689 Available: http://www.ncbi.nlm.nih.gov/pmc/articles/PMC1326070/. Accessed 5 September 2013. - PMC - PubMed

Publication types

Substances