. 2013 Oct 8;8(10):e71384.
doi: 10.1371/journal.pone.0071384. eCollection 2013.

Remote measurements of heart and respiration rates for telemedicine

Affiliations

Remote measurements of heart and respiration rates for telemedicine

Fang Zhao et al. PLoS One. .

Abstract

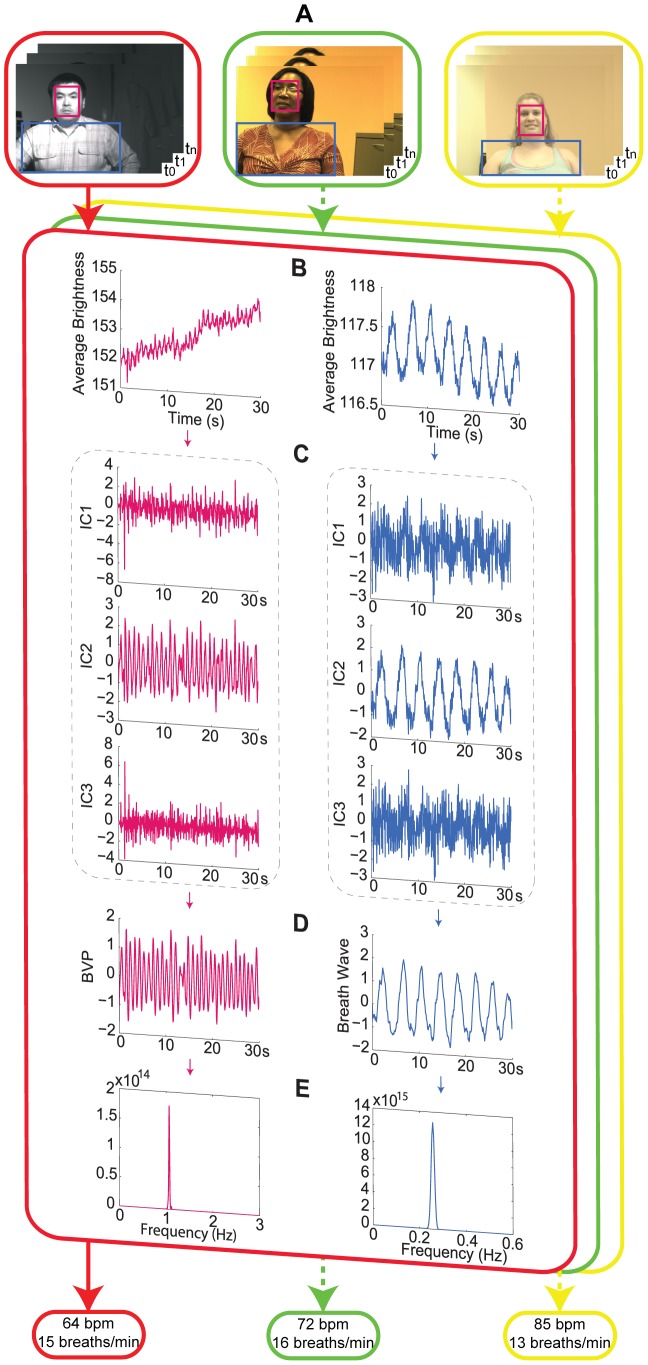
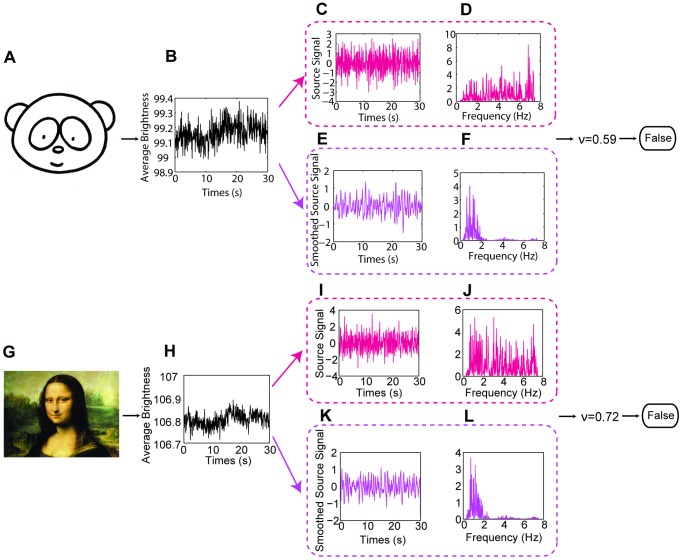
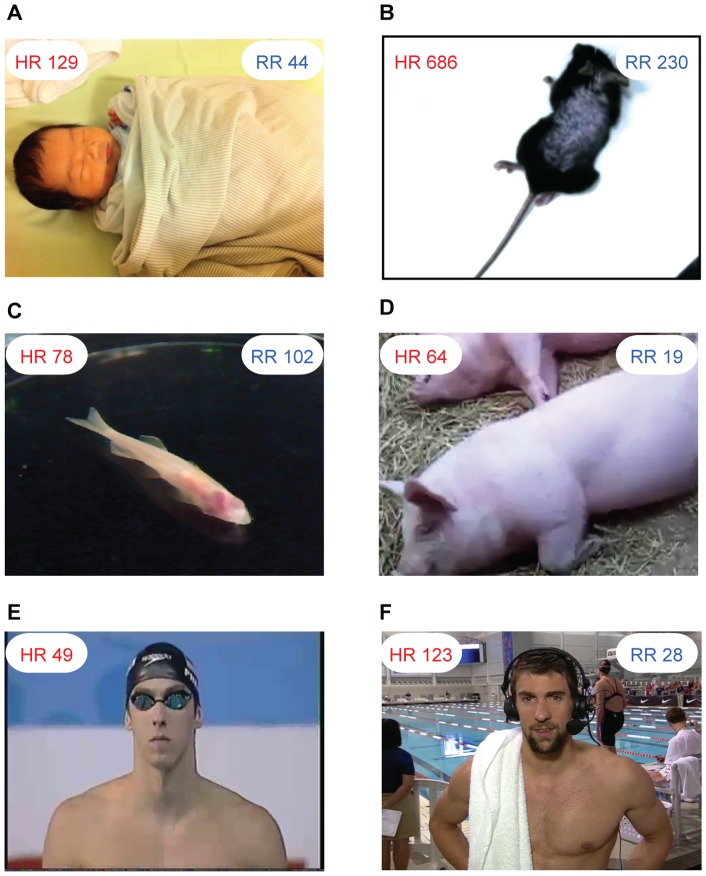
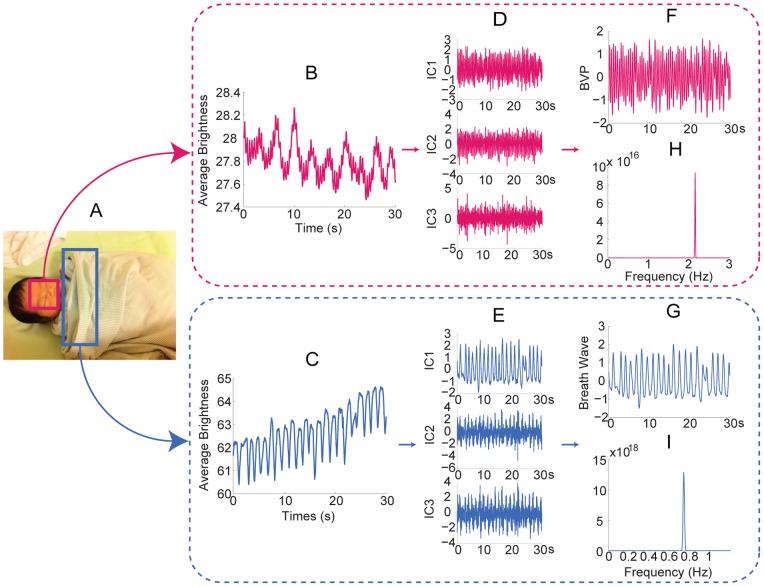
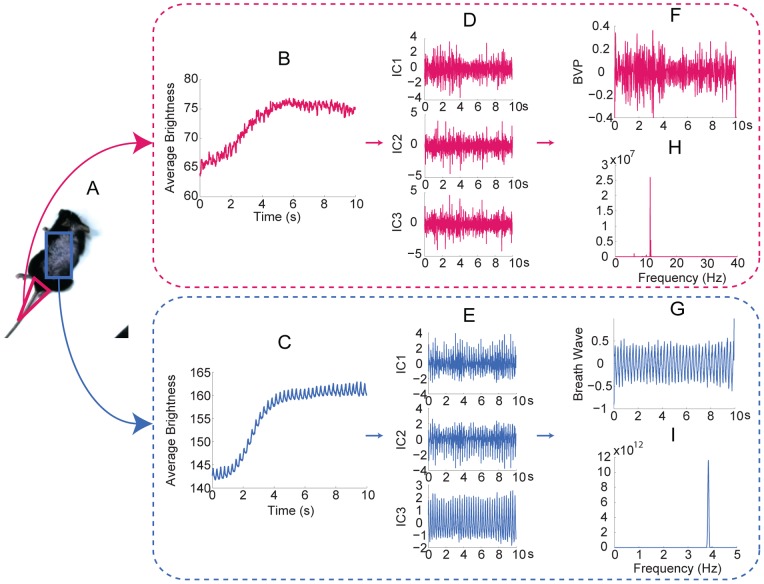
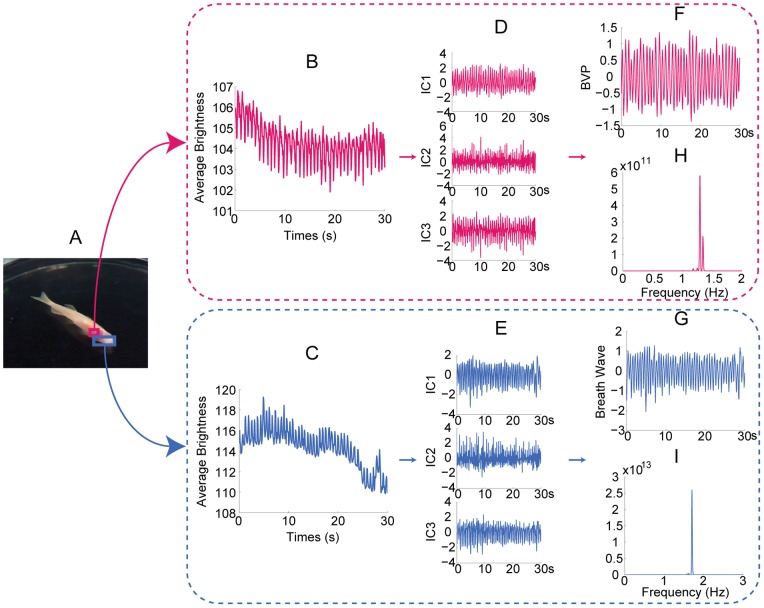
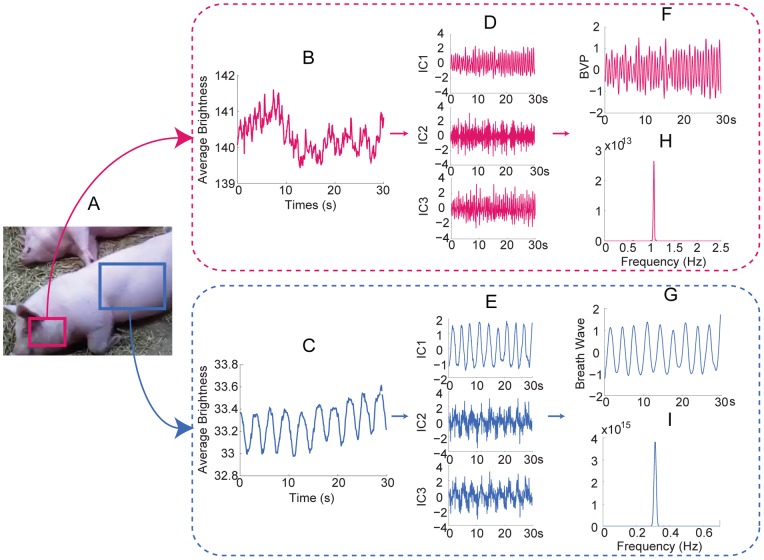
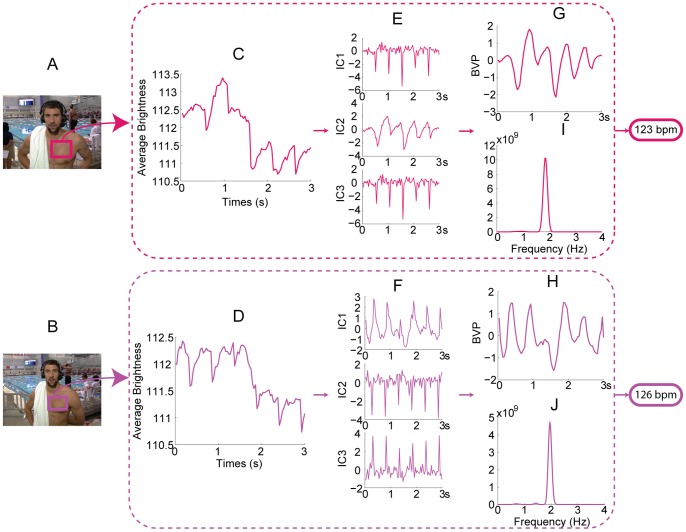
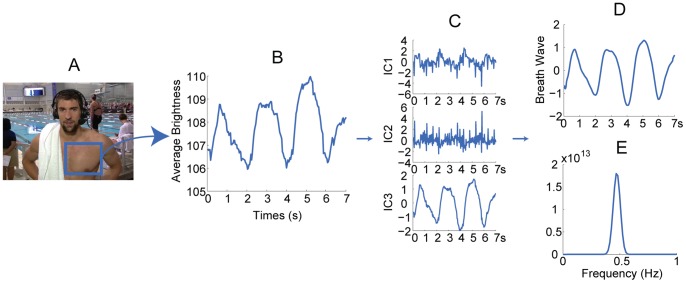
Non-contact and low-cost measurements of heart and respiration rates are highly desirable for telemedicine. Here, we describe a novel technique to extract blood volume pulse and respiratory wave from a single channel images captured by a video camera for both day and night conditions. The principle of our technique is to uncover the temporal dynamics of heart beat and breathing rate through delay-coordinate transformation and independent component analysis-based deconstruction of the single channel images. Our method further achieves robust elimination of false positives via applying ratio-variation probability distributions filtering approaches. Moreover, it enables a much needed low-cost means for preventing sudden infant death syndrome in new born infants and detecting stroke and heart attack in elderly population in home environments. This noncontact-based method can also be applied to a variety of animal model organisms for biomedical research.


Conflict of interest statement

Competing Interests: The authors have a patent entitled “Methods and systems for measuring dynamic changes in the physiological parameters of a subject” (United States application number 13/462,524. PCT application number PCT/US2013/029551 was filed). The authors declare that this does not alter the adherence to all the PLOS ONE policies on sharing data and materials.

Figures

Figure 1
Figure 1. Remotely obtain physiological parameters from single channel images.
Different colors of the rounded rectangles in the figure denote the procedure of different subjects. (A) A series of video frames of the upper body of a human subject recorded at night over a period of time (t 0t n). The rectangle superimposed on the subject's face indicates the region of interest for cardiovascular pulse measurement. The rectangle superimposed on the subject's chest indicates the region of interest for respiratory measurement. (B) The observed time series for cardiovascular pulse measurement (left) and respiratory measurement (right). (C) The separated source signals (independent components (ICs), IC1, IC2, and IC3) for cardiovascular pulse measurement (left) and respiratory measurement (right). (D) The recovered blood volume pulse (left) and respiratory wave (right). (E) A plot showing the frequency of the blood volume pulse (left) and respiratory wave (right). Written consent from all individuals whose photos are in figures 1 had been obtained.
Figure 2
Figure 2. Bland-Altman plots comparing the values obtained for physiological parameters of interest using the presented methods to values obtained using a contact reference method in nighttime and daytime, respectively.
The solid horizontal line indicates the mean for the data set; the dotted lines indicate the mean ±1.96 standard deviations. (A) HR of the subject imaged in night conditions. (B) RR of the subject imaged in night conditions. (C) HR of the subject imaged in daytime. (D) RR of the subject imaged in daytime.
Figure 3
Figure 3. Dynamic measurement of both HR and RR.
(A) A plot of HR measured in a subject as a function of time. (B) A plot of RR measured in a subject as a function of time. In both cases, physiological parameters were measured in a subject following moderate exercise.
Figure 4
Figure 4. The ratio-variation PDs.
Blue points: the ratio-variation PDs of real subjects. Red points: the ratio-variation PDs of inanimate subjects.
Figure 5
Figure 5. Examples of false signals recognition.
(A) Take a Simpsons cartoon character as an example. (B) The observed time series of the Simpsons cartoon is decomposed to extract (C) the source signal and (D) its power spectrum. (E) The smoothed source signal and (F) its power spectrum. (G) Another example is the Mona Lisa painting. (H) The observed time series of the Mona Lisa painting is decomposed to extract (I) the source signal and (J) its power spectrum. (K) The smoothed source signal and (L) its power spectrum.
Figure 6
Figure 6. Measurement results for different kinds of subjects.
(A) Thirty seconds video of a one-month old infant was recorded at 30fps when he was sleeping. The face area and shoulder area are selected as the ROI for cardiovascular pulse measurement and respiration measurement, respectively (Figure 7A). In the spectrum of the BVP signal (Figure 7H), a clear peak at 2.15 Hz corresponds to the HR of 129 bpm. In the spectrum of the breath wave signal (Figure 7I), an obvious peak at 0.73 Hz corresponds to the RR of 44 breaths/min. Written consent from the child’s parents had been obtained. (B) A high speed camera (Stingray F-033B/C with 80fps) was used to capture images of a mouse at rest over a period of about 10 seconds. Figure 8 demonstrates the procedure of recovering the HR and RR of a mouse from a single channel images. The measurement result of RR is 230 breaths/min and the measurement result of HR is 686 bpm. (C) For measuring adult zebrafish (roy/roy; alb/alb), we used tricaine to slightly anesthetize before the images were captured at 15 fps over a period of about 30 seconds in length. The ROI for cardiovascular pulse measurement and respiration measurement is the heart area and gilles area, respectively (Figure 9A). The measurement result for HR is 78 bpm and for RR is 102 breaths/min (for signal plot, see Figure 9). (D) The face area and abdomen area of the pig are chosen as the ROI for cardiovascular pulse measurement and respiration measurement, respectively (Figure 10A). The measurement results of HR and RR are 64 bpm and 19 breaths/min, respectively (for signal plot, see Figure 10). (E) A video of Phelps before 200 M butterfly competition downloaded from YouTube (http://www.youtube.com/watch?v=ftHlLqamWlM). The recovered HR from 3 seconds time period selected from the video is 49 bpm. (F) Post-race interview of Michael Phelps (after his 200 Fly meet) downloaded from YouTube (http://www.youtube.com/watch?v=HHy7QKEV310). The interview video was recorded at 29 fps with pixel resolution of 1280×720. Two time periods both about 3 seconds in length were selected from the video to recover the HR of Phelps (Figure 11). The time interval between two time periods is within one minute. The measurement results of HR for the first and second time periods are 123bpm and 126bpm, respectively. The RR was also extracted from the video over a period of about 7 seconds. The measurement result of RR is 28 breaths/min (for signal plot, see Figure 12). Reprinted from under a CC BY license, with permission from [Longhorn Network], original copyright [2012]
Figure 7
Figure 7. Measurement of neonate.
(A) The rectangle superimposed on the neonatal face indicates the ROI for cardiovascular pulse measurement. The rectangle superimposed on the neonatal shoulder indicates the ROI for respiratory measurement. 30 seconds observed time series for cardiovascular pulse measurement (B) and respiratory measurement (C). The separated source signals for cardiovascular pulse measurement (D) and respiratory measurement (E). The recovered blood volume pulse (F) and respiratory wave (G). The spectrums of the blood volume pulse (H) and respiratory wave (I). Written consent from the child's parents had been obtained.
Figure 8
Figure 8. Measurement of a mouse.
(A) The triangle and rectangle superimposed on the mouse indicate the ROI for cardiovascular pulse measurement and respiratory measurement, respectively. 10 seconds observed time series for cardiovascular pulse measurement (B) and respiratory measurement (C). The separated source signals for cardiovascular pulse measurement (D) and respiratory measurement (E). The recovered blood volume pulse (F) and respiratory wave (G). The spectrums of the blood volume pulse (H) and respiratory wave (I).
Figure 9
Figure 9. Measurement of a zebrafish.
(A) The rose and hyacinthine rectangle superimposed on the zebrafish indicate the ROI for cardiovascular pulse measurement and respiratory measurement, respectively. 30 seconds observed time series for cardiovascular pulse measurement (B) and respiratory measurement (C). The separated source signals for cardiovascular pulse measurement (D) and respiratory measurement (E). The recovered blood volume pulse (F) and respiratory wave (G). The spectrums of the blood volume pulse (H) and respiratory wave (I).
Figure 10
Figure 10. Measurement of a pig.
(A) The rose and hyacinthine rectangle superimposed on the pig indicate the ROI for cardiovascular pulse measurement and respiratory measurement, respectively. 30 seconds observed time series for cardiovascular pulse measurement (B) and respiratory measurement (C). The separated source signals for cardiovascular pulse measurement (D) and respiratory measurement (E). The recovered blood volume pulse (F) and respiratory wave (G). The spectrums of the blood volume pulse (H) and respiratory wave (I).
Figure 11
Figure 11. Extracting HR from Michael Phelps video obtained from YouTube.
All the red curves correspond to the first time period, and all the purple curves correspond to the second time period. The rectangles superimposed on his chest indicate the ROI for the first time period (A) and the second time period (B). 3 seconds observed time series from the first time period (C) and the second time period (D). The separated source signals for the first time period (E) and the second time period (F). The recovered blood volume pulses for the first time period (G) and the second time period (H). The spectrum of the blood volume pulses for the first time period (I) and the second time period (J). Reprinted from under a CC BY license, with permission from [Longhorn Network], original copyright [2012].
Figure 12
Figure 12. Extracting RR from Michael Phelps post-race interview video obtained from YouTube (http://www.youtube.com/watch?v=HHy7QKEV310).
(A) the rectangle superimposed on his chest indicates the ROI. (B) 7 seconds observed time series for respiratory measurement. (C) the separated source signals for respiratory measurement. (D) the recovered breath wave. (E) the frequency of the breath wave. Reprinted from under a CC BY license, with permission from [Longhorn Network], original copyright [2012].

References

    1. Stiedl O, Spiess J (1997) Effect of tone-dependent fear conditioning on heart rate and behavior of C57BL/6N mice. Behav Neurosci 111: 703–711. - PubMed
    1. Stiedl O, Tovote P, Ögren SO, Meyer M (2004) Behavioral and autonomic dynamics during contextual fear conditioning in mice. Auton Neurosci 115: 15–27. - PubMed
    1. Stiedl O, Jansen RF, Pieneman AW, Ögren SO, Meyer M (2009) Assessing aversive emotional states through the heart in mice: Implications for cardiovascular dysregulation in affective disorders. Neurosci Biobehav Rev 33: 181–190. - PubMed
    1. Liu J, Wei W, Kuang H, Zhao F, Tsien JZ (2013) Changes in heart rate variability are associated with expression of short-term and long-term contextual and cued fear memories. PLoS One 8: e63590. - PMC - PubMed
    1. Steinschneider A (1972) Prolonged apnea and the sudden infant death syndrome: clinical and laboratory observations. Pediatrics 50: 646–654. - PubMed

Publication types