

Dysregulation of complement system and CD4+ T cell activation pathways implicated in allergic response
- PMID: 24116013
- PMCID: PMC3792967
- DOI: 10.1371/journal.pone.0074821
Dysregulation of complement system and CD4+ T cell activation pathways implicated in allergic response
Abstract
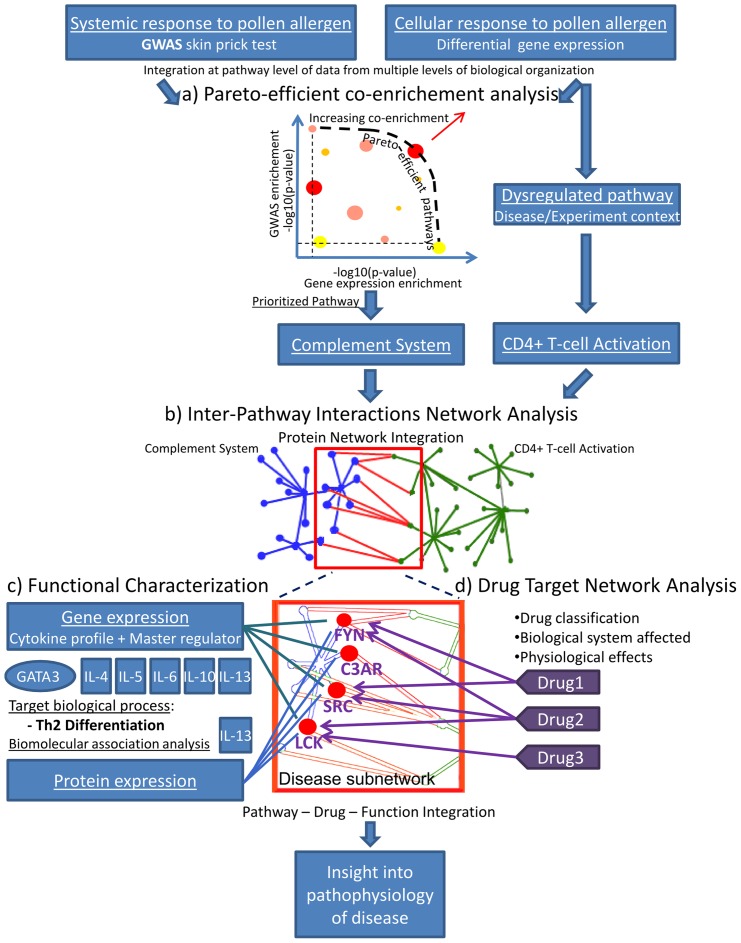
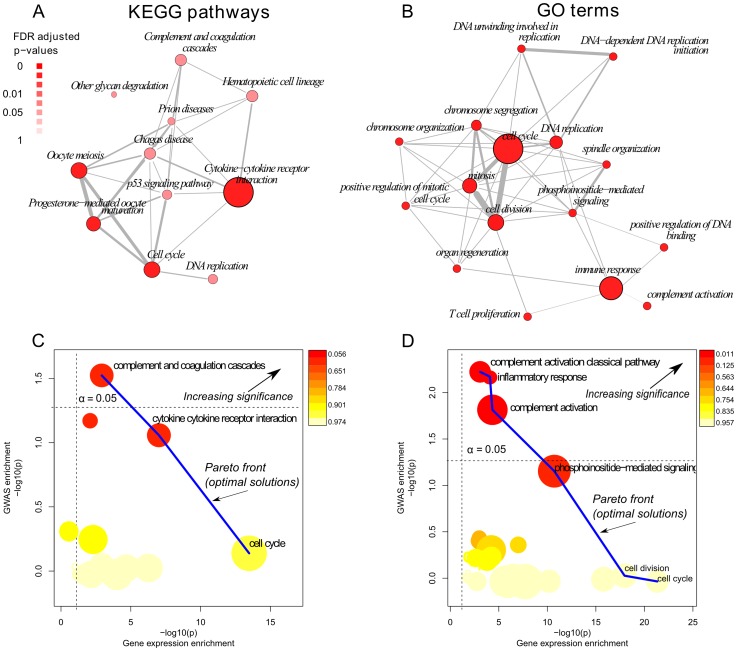
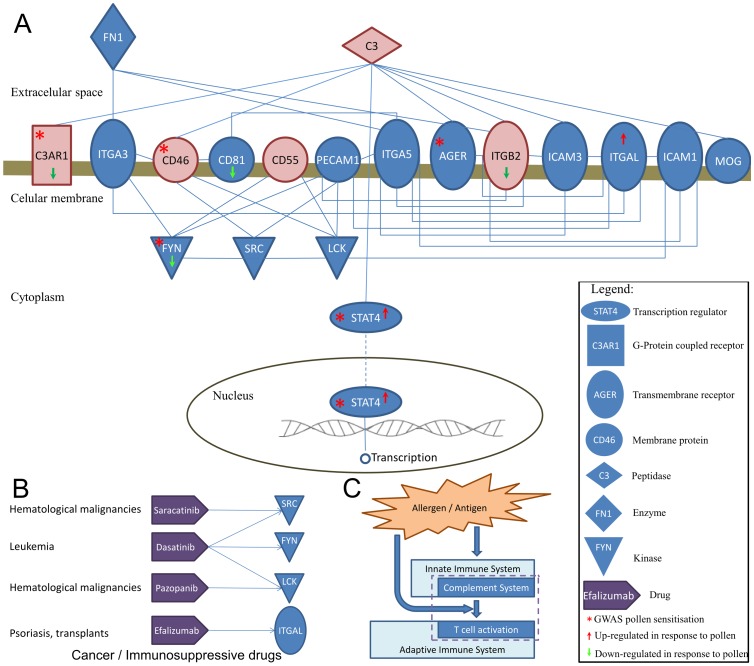
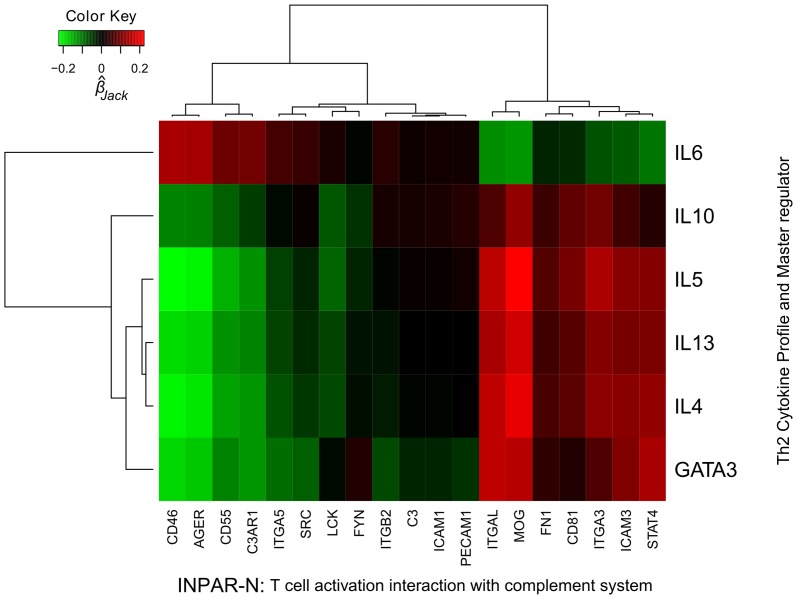
Allergy is a complex disease that is likely to involve dysregulated CD4+ T cell activation. Here we propose a novel methodology to gain insight into how coordinated behaviour emerges between disease-dysregulated pathways in response to pathophysiological stimuli. Using peripheral blood mononuclear cells of allergic rhinitis patients and controls cultured with and without pollen allergens, we integrate CD4+ T cell gene expression from microarray data and genetic markers of allergic sensitisation from GWAS data at the pathway level using enrichment analysis; implicating the complement system in both cellular and systemic response to pollen allergens. We delineate a novel disease network linking T cell activation to the complement system that is significantly enriched for genes exhibiting correlated gene expression and protein-protein interactions, suggesting a tight biological coordination that is dysregulated in the disease state in response to pollen allergen but not to diluent. This novel disease network has high predictive power for the gene and protein expression of the Th2 cytokine profile (IL-4, IL-5, IL-10, IL-13) and of the Th2 master regulator (GATA3), suggesting its involvement in the early stages of CD4+ T cell differentiation. Dissection of the complement system gene expression identifies 7 genes specifically associated with atopic response to pollen, including C1QR1, CFD, CFP, ITGB2, ITGAX and confirms the role of C3AR1 and C5AR1. Two of these genes (ITGB2 and C3AR1) are also implicated in the network linking complement system to T cell activation, which comprises 6 differentially expressed genes. C3AR1 is also significantly associated with allergic sensitisation in GWAS data.
Conflict of interest statement
Figures
Similar articles
-
A network-based analysis of allergen-challenged CD4+ T cells from patients with allergic rhinitis.Genes Immun. 2006 Sep;7(6):514-21. doi: 10.1038/sj.gene.6364322. Epub 2006 Jul 6. Genes Immun. 2006. PMID: 16826235
-
The T cell response to major grass allergens is regulated and includes IL-10 production in atopic but not in non-atopic subjects.Int Arch Allergy Immunol. 2010;152(3):243-54. doi: 10.1159/000283033. Epub 2010 Feb 11. Int Arch Allergy Immunol. 2010. PMID: 20150742
-
Allergen-stimulated interleukin-4 and interferon-gamma production in primary culture: responses of subjects with allergic rhinitis and normal controls.Immunology. 1995 Jul;85(3):373-80. Immunology. 1995. PMID: 7558124 Free PMC article.
-
Effector cell signature in peripheral blood following nasal allergen challenge in grass pollen allergic individuals.Allergy. 2015 Feb;70(2):171-9. doi: 10.1111/all.12543. Allergy. 2015. PMID: 25377909
-
A haplotype in the inducible T-cell tyrosine kinase is a risk factor for seasonal allergic rhinitis.Allergy. 2009 Sep;64(9):1286-91. doi: 10.1111/j.1398-9995.2009.01991.x. Epub 2009 Feb 13. Allergy. 2009. PMID: 19222422
Cited by
-
Complement mediators: key regulators of airway tissue remodeling in asthma.J Transl Med. 2015 Aug 20;13:272. doi: 10.1186/s12967-015-0565-2. J Transl Med. 2015. PMID: 26289385 Free PMC article. Review.
-
NLRP3 is Required for Complement-Mediated Caspase-1 and IL-1beta Activation in ICH.J Mol Neurosci. 2017 Mar;61(3):385-395. doi: 10.1007/s12031-016-0874-9. Epub 2016 Dec 8. J Mol Neurosci. 2017. PMID: 27933491
-
Lipid metabolic reprogramming of hepatic CD4+ T cells during SIV infection.Microbiol Spectr. 2023 Sep 1;11(5):e0168723. doi: 10.1128/spectrum.01687-23. Online ahead of print. Microbiol Spectr. 2023. PMID: 37656815 Free PMC article.
-
Seasonal Proteomic Variations and Biomarkers in Seasonal Allergic Rhinitis: Insights from Olink Inflammation Profiling.J Inflamm Res. 2025 May 12;18:6191-6202. doi: 10.2147/JIR.S519126. eCollection 2025. J Inflamm Res. 2025. PMID: 40386182 Free PMC article.
-
Investigation of the Mechanism of Complement System in Diabetic Nephropathy via Bioinformatics Analysis.J Diabetes Res. 2021 May 24;2021:5546199. doi: 10.1155/2021/5546199. eCollection 2021. J Diabetes Res. 2021. PMID: 34124269 Free PMC article.
References
-
- Kay AB (2001) Allergy and allergic diseases. First of two parts. N Engl J Med 344: 30–37. - PubMed
-
- Benson M, Carlsson L, Guillot G, Jernas M, Langston MA, et al. (2006) A network-based analysis of allergen-challenged CD4+ T cells from patients with allergic rhinitis. Genes Immun 7: 514–521. - PubMed
-
- Hansel NN, Cheadle C, Diette GB, Wright J, Thompson KM, et al. (2008) Short communication: Analysis of CD4+ T-cell gene expression in allergic subjects using two different microarray platforms. Allergy 63: 366–369. - PubMed
-
- Wang H, Mobini R, Fang Y, Barrenäs F, Zhang H, et al. (2010) Allergen challenge of peripheral blood mononuclear cells from patients with seasonal allergic rhinitis increases IL-17RB, which regulates basophil apoptosis and degranulation. Clinical & Experimental Allergy 40: 1194–1202. - PubMed
Publication types
MeSH terms
Substances
Grants and funding
LinkOut - more resources
Full Text Sources
Other Literature Sources
Medical
Molecular Biology Databases
Research Materials
Miscellaneous
