. 2013 Oct 7;8(10):e74957.
doi: 10.1371/journal.pone.0074957. eCollection 2013.

Bacterial community mapping of the mouse gastrointestinal tract

Affiliations

Bacterial community mapping of the mouse gastrointestinal tract

Shenghua Gu et al. PLoS One. .

Abstract

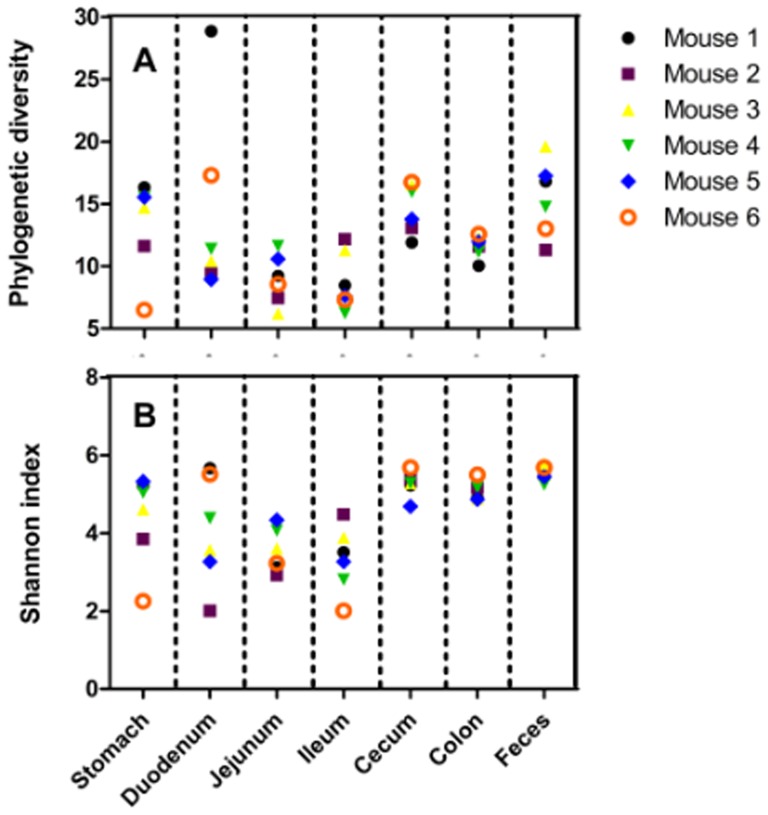
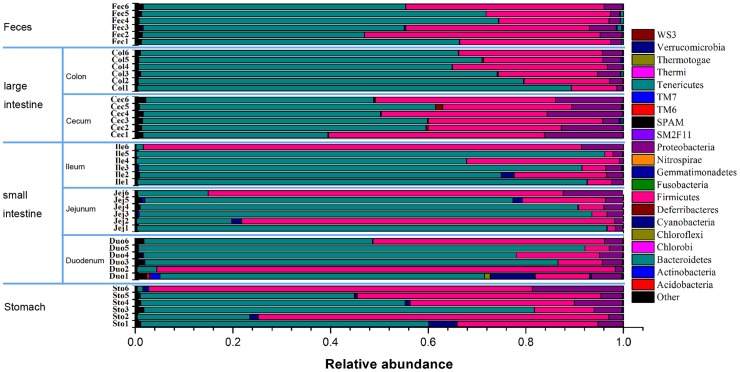
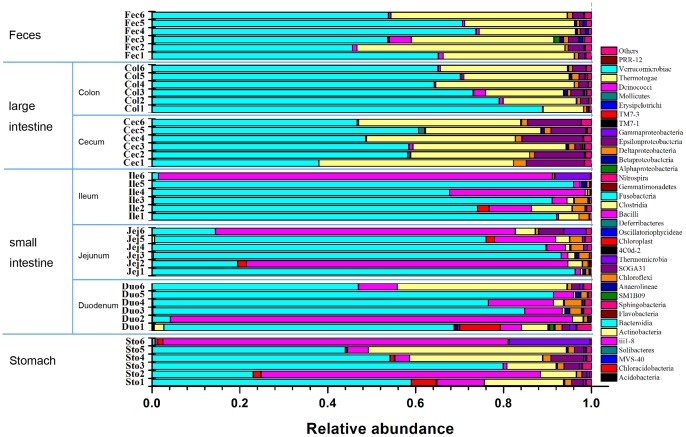
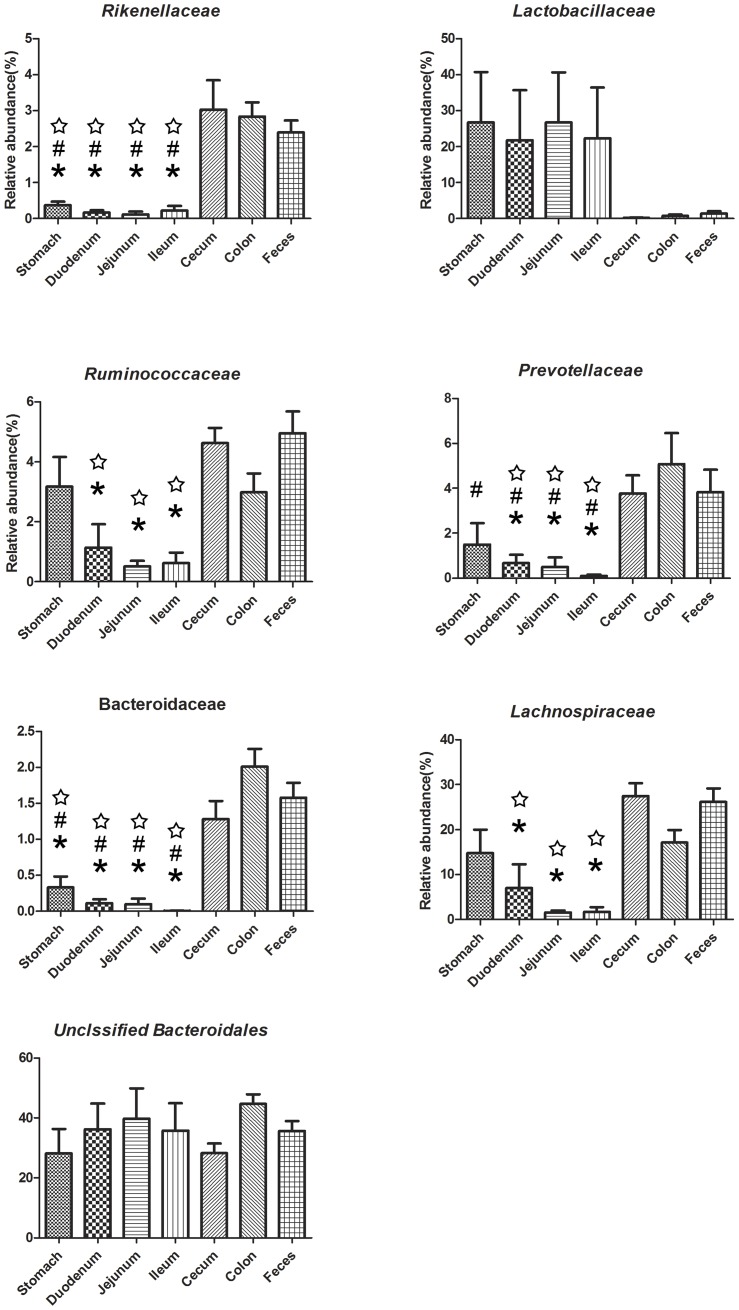
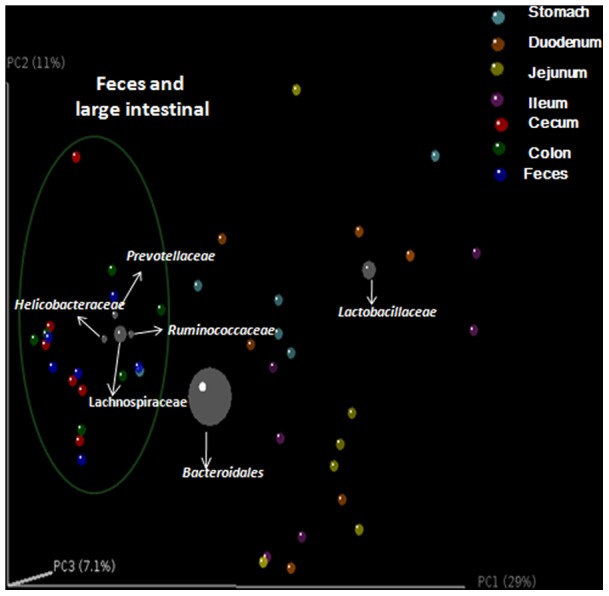
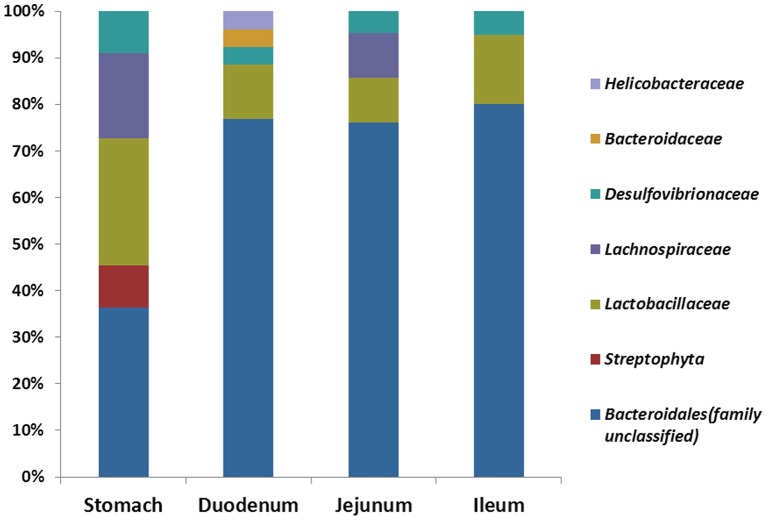
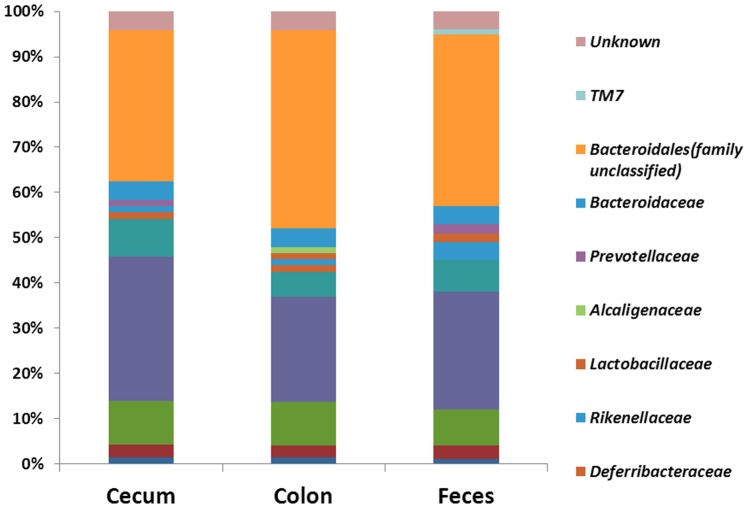
Keeping mammalian gastrointestinal (GI) tract communities in balance is crucial for host health maintenance. However, our understanding of microbial communities in the GI tract is still very limited. In this study, samples taken from the GI tracts of C57BL/6 mice were subjected to 16S rRNA gene sequence-based analysis to examine the characteristic bacterial communities along the mouse GI tract, including those present in the stomach, duodenum, jejunum, ileum, cecum, colon and feces. Further analyses of the 283,234 valid sequences obtained from pyrosequencing revealed that the gastric, duodenal, large intestinal and fecal samples had higher phylogenetic diversity than the jejunum and ileum samples did. The microbial communities found in the small intestine and stomach were different from those seen in the large intestine and fecal samples. A greater proportion of Lactobacillaceae were found in the stomach and small intestine, while a larger proportion of anaerobes such as Bacteroidaceae, Prevotellaceae, Rikenellaceae, Lachnospiraceae, and Ruminococcaceae were found in the large intestine and feces. In addition, inter-mouse variations of microbiota were observed between the large intestinal and fecal samples, which were much smaller than those between the gastric and small intestinal samples. As far as we can ascertain, ours is the first study to systematically characterize bacterial communities from the GI tracts of C57BL/6 mice.


Conflict of interest statement

Competing Interests: The authors have declared that no competing interests exist.

Figures

Figure 1
Figure 1. Alpha diversity.
(A) phylogenetic diversity (PD) and (B) Shannon diversity of each GI site from the six mice.
Figure 2
Figure 2. Relative abundance of sequences belonging to different bacterial phyla.
Sequences that could not be classified into any known group were assigned as ‘Unknown’. Sto: Stomach samples; Duo: Duodenum samples; Jej: Jejunum samples; Ile: Ileum samples; Cec: Cecum samples; Col: Colon samples; Fec: Feces samples. The number following the abbreviations stands for the mouse number. For example, Cec1, Cec2, Cec3, Cec4, Cec5, and Cec6 stands for the Cecum sample from the 1st, 2nd, 3rd, 4th, 5th and 6th mouse.
Figure 3
Figure 3. Relative abundance of sequences belonging to different bacterial Class.
Sto: Stomach samples; Duo: Duodenum samples; Jej: Jejunum samples; Ile: Ileum samples; Cec: Cecum samples; Col: Colon samples; Fec: Feces samples. The number following the abbreviations stands for the mouse number. For example, Cec1, Cec2, Cec3, Cec4, Cec5, and Cec6 stands for the Cecum sample from the 1st, 2nd, 3rd, 4th, 5th and 6th mouse.
Figure 4
Figure 4. Relative abundance of sequences belonging to different bacterial Class.
(☆, P<0.05, compared to Cecum; #, P<0.05, compared to Colon; *, P<0.05, compared to Feces, by Tukey's honestly significant difference (HSD) post hoc test).
Figure 5
Figure 5. Contribution of different taxonomic groups to separation of samples based on phylogenetic information.
The contribution of each group is represented by the size of the circles (grey) overlaid onto a PCoA of unweighted UniFrac distances for all samples within mice digestive tract.
Figure 6
Figure 6. Operational taxonomic unit (OTU) network analysis of bacterial communities from mice GI tract samples for the V3 16S rRNA region.
Figure 7
Figure 7. The composition of “core” microbiota of stomach, duodenum, jejunum, and ileum samples.
Figure 8
Figure 8. The composition of “core” microbiota of cecum, colon and feces samples.

References

    1. Backhed F, Ley RE, Sonnenburg JL, Peterson DA, Gordon JI (2005) Host-bacterial mutualism in the human intestine. Science 307: 1915–1920. - PubMed
    1. Dethlefsen L, McFall-Ngai M, Relman DA (2007) An ecological and evolutionary perspective on human-microbe mutualism and disease. Nature 449: 811–818. - PMC - PubMed
    1. Cani PD, Bibiloni R, Knauf C, Waget A, Neyrinck AM, et al. (2008) Changes in gut microbiota control metabolic endotoxemia-induced inflammation in high-fat diet-induced obesity and diabetes in mice. Diabetes 57: 1470–1481. - PubMed
    1. Ley RE, Turnbaugh PJ, Klein S, Gordon JI (2006) Microbial ecology: human gut microbes associated with obesity. Nature 444: 1022–1023. - PubMed
    1. Dumas ME, Barton RH, Toye A, Cloarec O, Blancher C, et al. (2006) Metabolic profiling reveals a contribution of gut microbiota to fatty liver phenotype in insulin-resistant mice. Proc Natl Acad Sci U S A 103: 12511–12516. - PMC - PubMed

Publication types