. 2013 Oct 8;8(10):e76345.
doi: 10.1371/journal.pone.0076345. eCollection 2013.

Sox2 expression is regulated by a negative feedback loop in embryonic stem cells that involves AKT signaling and FoxO1

Affiliations

Sox2 expression is regulated by a negative feedback loop in embryonic stem cells that involves AKT signaling and FoxO1

Briana D Ormsbee Golden et al. PLoS One. .

Abstract

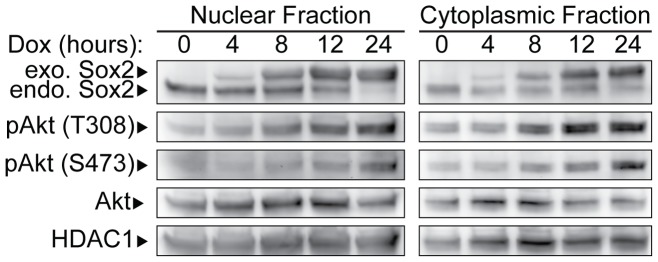
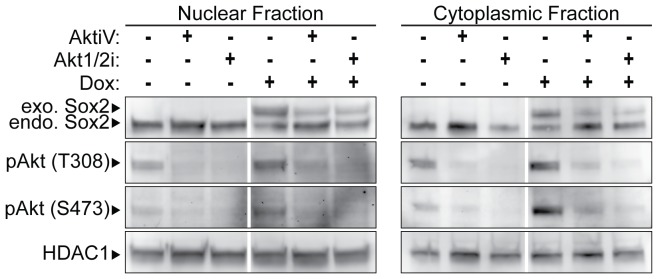
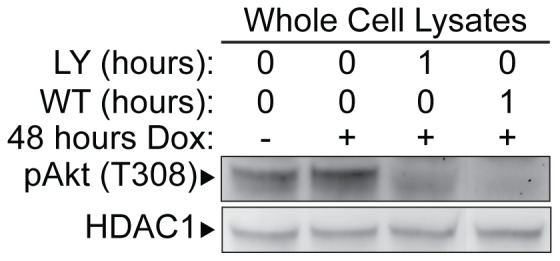
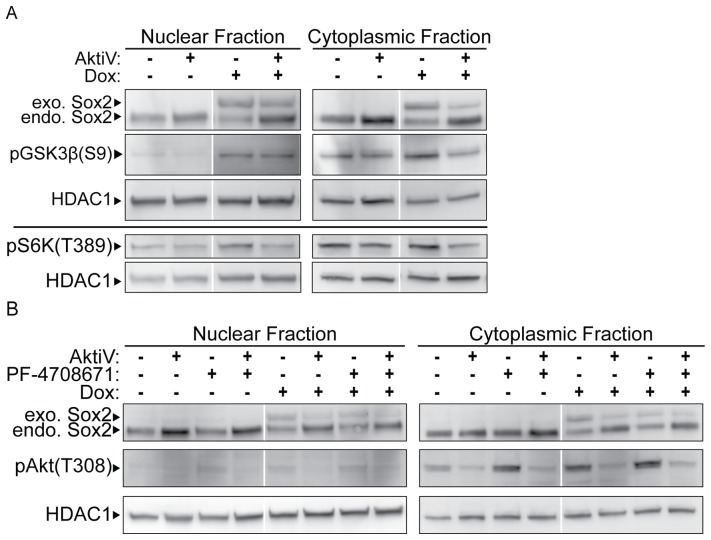
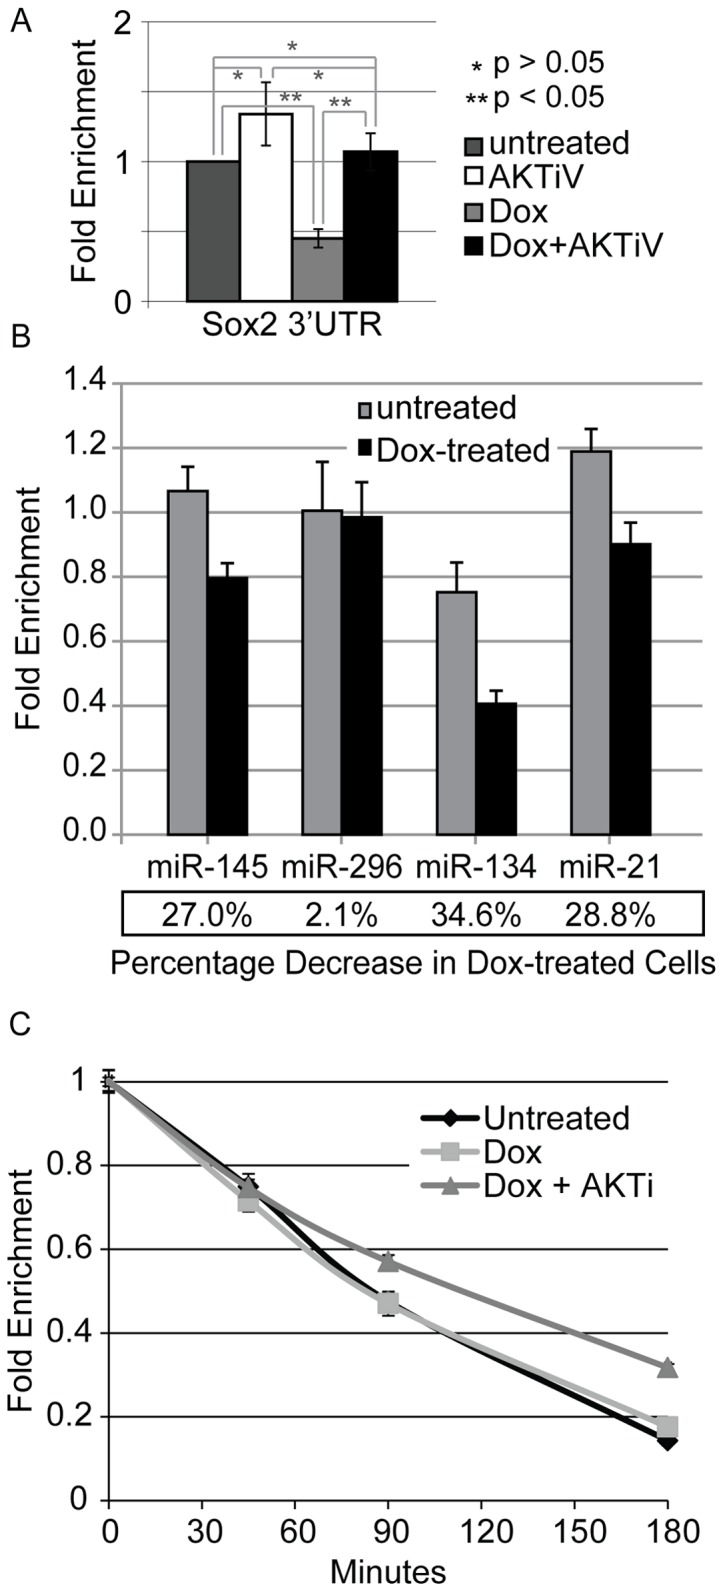
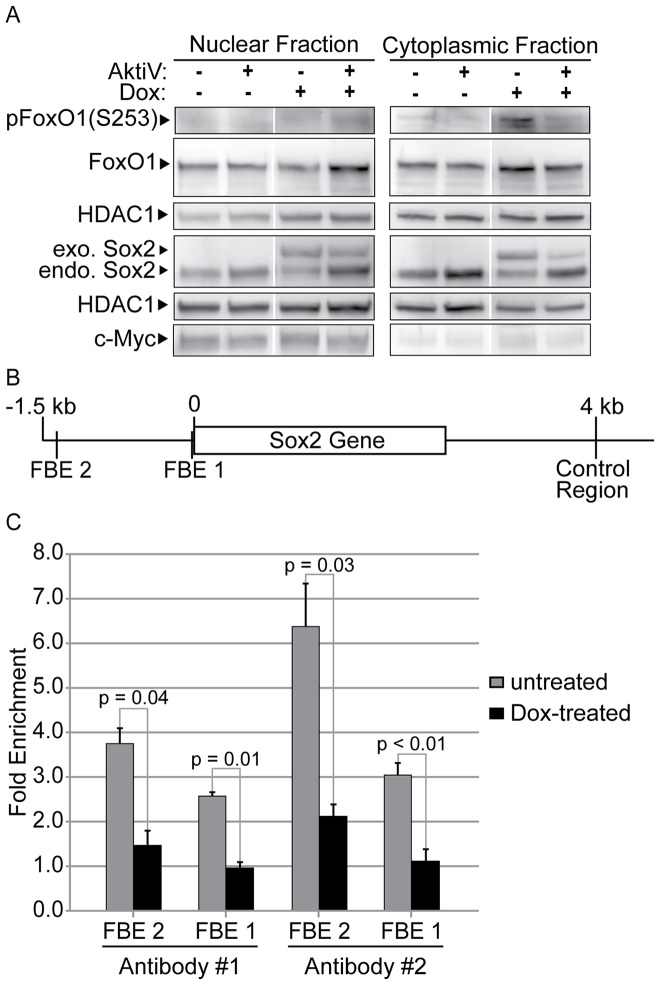
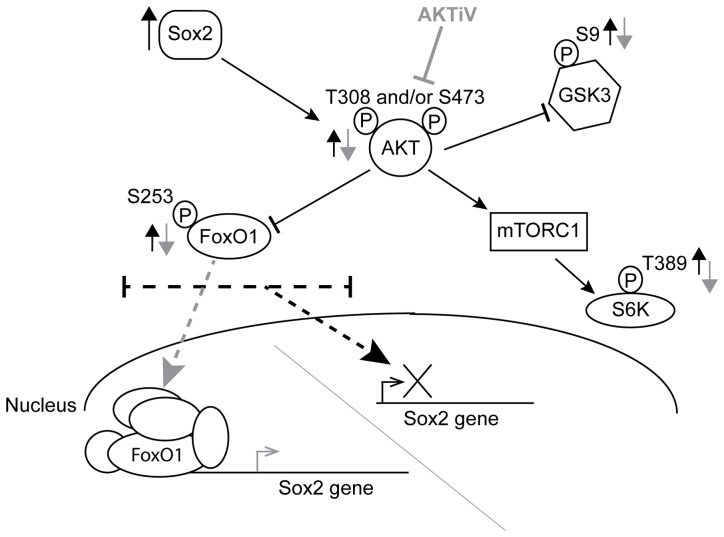
The self-renewal and pluripotency of embryonic stem cells (ESC) is regulated by a highly integrated network of essential transcription factors, which includes Sox2. Previous studies have shown that elevating Sox2 on its own in mouse ESC induces differentiation and inhibits the expression of endogenous Sox2 at the protein and mRNA level. These findings led us to hypothesize that increases in Sox2 activate a negative feedback loop that inhibits the transcription of the endogenous Sox2 gene. To test this hypothesis, we used i-OSKM-ESC, which elevate Sox2 in conjunction with Oct4, Klf4, and c-Myc when treated with doxycycline (Dox). Elevating the expression of these four transcription factors in i-OSKM-ESC does not induce differentiation, but it represses expression of endogenous Sox2. We determined that increases of Sox2 in i-OSKM-ESC lead to increases in activated AKT and inactivation of FoxO1 (an activator of Sox2), as well as decreases in binding of FoxO1 to the 5'flanking region of Sox2. Importantly, we determined that inhibition of AKT in Dox-treated i-OSKM-ESC leads to re-expression of endogenous Sox2 at the mRNA and protein level and reactivation of FoxO1. These findings argue that AKT signaling is part of the negative feedback loop that helps carefully control the transcription of Sox2 in ESC by modulating the binding of FoxO1 to the Sox2 gene. Collectively, our findings provide new insights into the mechanisms that enable ESC to carefully regulate the levels of Sox2 and retain their stem cell properties.


Conflict of interest statement

Competing Interests: The authors have declared that no competing interests exist.

Figures

Figure 1
Figure 1. Time course of endogenous Sox2 inhibition.
i-OSKM-ESC were seeded at 1.5×10⁶ per 100 mm dish and cultured for 24 hours. The cells were refed with fresh medium with or without 4 μg/ml Dox for the number of hours indicated and nuclear and cytoplasmic extracts were prepared from the cells. Equal amounts of nuclear and cytoplasmic protein were loaded into each well of an SDS-PAGE and western blot analysis was performed by sequentially probing for Sox2, pAKT(T308), and pAKT(S473), total AKT and HDAC1. HDAC1 served as a protein loading control.
Figure 2
Figure 2. Effects of AKT, GSK3 and MEK inhibitors on the expression of endogenous Sox2.
1.5×10⁶ i-OSKM-ESCs were cultured in 100 mm dishes with or without 4 μg/ml Dox. (A) 24 hours after the cells were plated in the absence or presence of Dox, 5 µM AKTiV and 3 µM CHIR were added to the cells for an additional 24 hours where indicated. (B) 24 hours after the cells were plated in the absence or presence of Dox, 5 µM AKTiV and 0.4 µM MEKi were added to the cells for an additional 24 hours where indicated. For A-B, nuclear and cytoplasmic protein extracts were prepared from the cells and equal amounts of nuclear and cytoplasmic protein were loaded into each well of an SDS-PAGE. Western blot analysis was performed by sequentially probing for Sox2 and HDAC1 in A and B. In each case, HDAC1 served as a protein loading control.
Figure 3
Figure 3. Effects of two different AKT inhibitors on the expression of endogenous Sox2.
i-OSKM-ESC were seeded at 1.5×10⁶ per 100 mm dish with or without 4 μg/ml Dox for 24 hours. (A) After the initial 24 hours, the cells were refed with fresh medium with or without 4 μg/ml Dox, and treated with 5 μM AKTiV or 5 μM AKT1/2i for an additional 24 hours where indicated. 48 hours after the cells were plated, nuclear and cytoplasmic protein extracts were prepared and equal amounts of nuclear and cytoplasmic protein were loaded into each well of an SDS-PAGE. Western blot analysis was performed by sequentially probing for pAKT(T308), pAKT (S473), Sox2 and HDAC1, which served as a protein loading control.
Figure 4
Figure 4. Effects of PI3K inhibitors on the phosphorylation of AKT.
i-OSKM-ESC were seeded at 1.5×10⁶ per 100 mm dish with or without 4 μg/ml Dox for 48 hours. Where indicated, the cells were treated during the last hour with either 10 μM LY294002 (LY) or 200 nM Wortmannin (WT). 48 hours after the cells were plated, whole cell extracts were prepared and equal amounts of protein were loaded into each well of an SDS-PAGE. Western blot analysis was performed by sequentially probing for pAKT(T308) and HDAC1, which served as a protein loading control.
Figure 5
Figure 5. Effects of elevating Sox2 on phosphorylation of GSK3β and S6K.
i-OSKM-ESC were seeded at 1.5×10⁶ per 100 mm dish with or without 4 μg/ml Dox for 24 hours. (A) After the initial 24 hours, the cells were refed with fresh medium with or without 4 μg/ml Dox, and treated with 5 μM AKTiV for an additional 24 hours where indicated. 48 hours after the cells were plated, nuclear and cytoplasmic protein extracts were prepared and equal amounts of nuclear and cytoplasmic protein were loaded into each well of an SDS-PAGE. Western blot analysis was performed by sequentially probing for pGSK3β(S9), Sox2 and HDAC1 (top) or pS6K(T389) and HDAC1 (bottom). (B) After the initial 24 hours, the cells were refed with fresh medium with or without 4 μg/ml Dox, and treated with 5 μM AKTiV and/or PF-4708671 for an additional 24 hours where indicated. As in A, nuclear and cytoplasmic extracts were prepared from the cells and western blot analysis was performed by sequentially probing for pAKT(T308), Sox2 and HDAC1. In each case, HDAC1 served as a protein loading control.
Figure 6
Figure 6. Changes in Sox2 mRNA and miRNA expression induced by increases in Sox2 protein.
i-OSKM-ESC were seeded at 1.5×10⁶ per 100 mm dish with or without 4 μg/ml Dox for 24 hours. (A) After the initial 24 hours, the cells were refed with fresh medium with or without 4 μg/ml Dox and/or 5 μM AKTiV for an additional 24 hours where indicated. 48 hours after the cells were plated, total RNA was isolated from the cells, and RT-qPCR was performed. A primer set specific to the untranslated region at the 3'-end (3'UTR), measuring endogenous Sox2 mRNA, was used in qPCR analysis performed in triplicate. Results are presented as the average fold change of mRNA expression, normalized to GAPDH expression, and compared to untreated i-OSKM-ESC. Statistical significance was determined by Student's t-test and indicated with asterisks: *p>0.05, **p<0.05. Detection of the Dox-inducible transgene expression may be underestimated due to possible limitations of the reverse transcription of the long poly-cistronic transcript that encodes for Oct4, Sox2, Klf4, and c-Myc. (B) After an initial 24 hours, i-OSKM-ESC were refed with fresh medium with or without 4 μg/ml Dox for an additional 24 hours, followed by isolation of total RNA. RT-qPCR using TaqMan probes was performed in triplicate to determine the expression of miR-145, miR-296, miR-134, and miR-21, normalized to RNU6B expression, and reported as average differences in fold change from RNU6B expression. (C) i-OSKM-ESC were seeded at 0.6×10⁶ per 60 mm dish with or without Dox (4 μg/ml). After an initial 24 hours, the cells were refed with fresh medium with or without 4 μg/ml Dox and with 5 μM AKTiV for an additional 24 hours where indicated. RNA synthesis was blocked with 5 µg/ml actinomycin D and total RNA was isolated from the cells at 0, 45, 90, and 180 minutes after actinomycin D treatment (48 hours after plating). RT-qPCR was performed with a primer set specific to the untranslated region at the 3'-end (3'UTR) to measure the remaining endogenous Sox2 mRNA. Results are presented as the average fold change of mRNA expression, normalized to GAPDH expression, and shown as a percentage of remaining mRNA compared to the amount of mRNA present in each treatment before the addition of actinomycin D. Error bars represent standard error of the mean, n = 3. This experiment was repeated with longer periods of actinomycin D treatments and similar results were observed.
Figure 7
Figure 7. Elevated Sox2 alters FoxO1 phosphorylation and its binding to regulatory regions of the Sox2 gene.
i-OSKM-ESC were seeded at 1.5×10⁶ per 100 mm dish with or without 4 μg/ml Dox for 24 hours. (A) After the initial 24 hours, the cells were refed with fresh medium with or without 4 μg/ml Dox, and treated with 5 μM AKTiV for an additional 24 hours where indicated. 48 hours after the cells were plated, nuclear and cytoplasmic protein extracts were prepared and equal amounts of nuclear and cytoplasmic protein were loaded into each well of an SDS-PAGE. Western blot analysis was performed by sequentially probing for pFoxO1(S253), total FoxO1, Sox2, HDAC1, and c-Myc. HDAC1 was used as a loading control for two separate western blots performed with the same protein extracts. c-Myc was used as a loading control to confirm proper separation of nuclear and cytoplasmic extracts. The levels of c-Myc in nuclear and cytoplasmic extracts were monitored simultaneously in western blots that were imaged together. (B) Schematic of the location of FBE1, FBE2, and the Sox2 control region within the regulatory regions of the Sox2 gene. (C) Chromatin immunoprecipitation (ChIP) analysis of DNA immunoprecipitated from untreated or Dox-treated i-OSKM-ESC using two different anti-FoxO1 antibodies (#1: Cell Signaling Technology, #2: Santa Cruz) and an IgG (GFP) control antibody for normalization. Analysis was performed in triplicate by qPCR and the values for the FoxO1 immunoprecipitated DNA were normalized to the input samples and the control antibody. The fold change of FoxO1 binding was determined by comparing FoxO1 antibody immunoprecipitation of FBE1 and FBE2 to immunoprecipitation of the Sox2 control region from untreated and Dox-treated i-OSKM-ESC. The results are presented as averages of the triplicate results and error is presented as the standard error of the mean. These findings are statistically significant with p-values all <0.05, as determined by Student's t-test.
Figure 8
Figure 8. An AKT-mediated negative feedback loop tightly controls Sox2 gene expression upon elevation of Sox2 protein.
The effects of elevating Sox2 in ESC are represented by black arrows, and the effects of treating ESC with AKTiV are represented by gray arrows.

Similar articles

Cited by

References

    1. Rizzino A (2013) The Sox2-Oct4 connection: Critical players in a much larger interdependent network integrated at multiple levels. Stem Cells. - PMC - PubMed
    1. Niwa H, Miyazaki J, Smith AG (2000) Quantitative expression of oct-3/4 defines differentiation, dedifferentiation or self-renewal of ES cells. Nat Genet 24: 372–376. - PubMed
    1. Chew JL, Loh YH, Zhang W, Chen X, Tam WL, et al. (2005) Reciprocal transcriptional regulation of Pou5f1 and Sox2 via the Oct4/Sox2 complex in embryonic stem cells. Mol Cell Biol 25: 6031–6046. - PMC - PubMed
    1. Kopp JL, Ormsbee BD, Desler M, Rizzino A (2008) Small increases in the level of Sox2 trigger the differentiation of mouse embryonic stem cells. Stem Cells 26: 903–911. - PubMed
    1. Okumura-Nakanishi S, Saito M, Niwa H, Ishikawa F (2005) Oct-3/4 and Sox2 regulate oct-3/4 gene in embryonic stem cells. J Biol Chem 280: 5307–5317. - PubMed

Publication types

MeSH terms