. 2013 Oct 8;8(10):e76347.
doi: 10.1371/journal.pone.0076347. eCollection 2013.

Genetic interactions between Brn3 transcription factors in retinal ganglion cell type specification

Affiliations

Genetic interactions between Brn3 transcription factors in retinal ganglion cell type specification

Melody Shi et al. PLoS One. .

Abstract

Background: Visual information is conveyed from the retina to the brain via 15-20 Retinal Ganglion Cell (RGC) types. The developmental mechanisms by which RGC types acquire their distinct molecular, morphological, physiological and circuit properties are essentially unknown, but may involve combinatorial transcriptional regulation. Brn3 transcription factors are expressed in RGCs from early developmental stages, and are restricted in adults to distinct, partially overlapping populations of RGC types. Previously, we described cell autonomous effects of Brn3b (Pou4f2) and Brn3a (Pou4f1) on RGC axon and dendrites development.

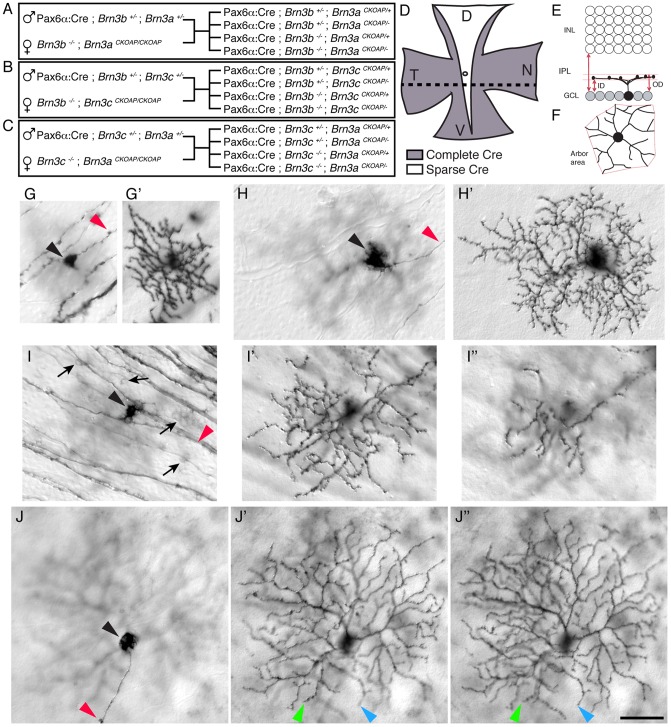
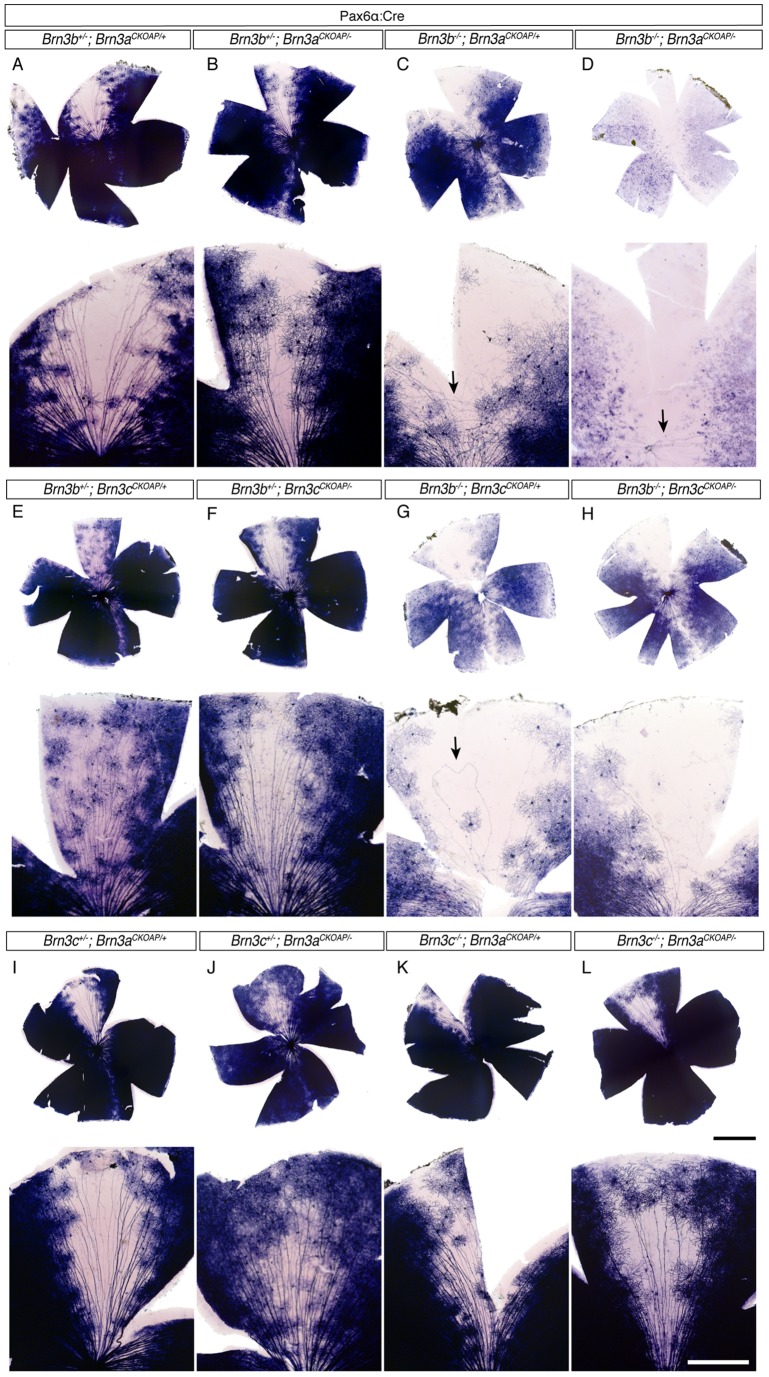
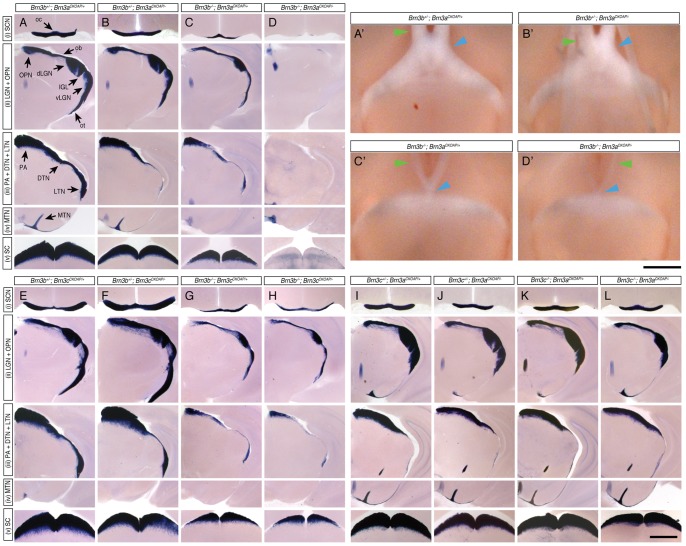
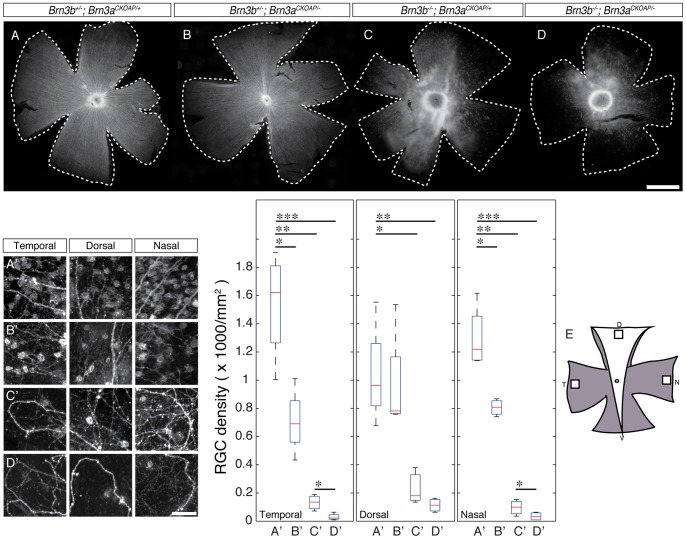
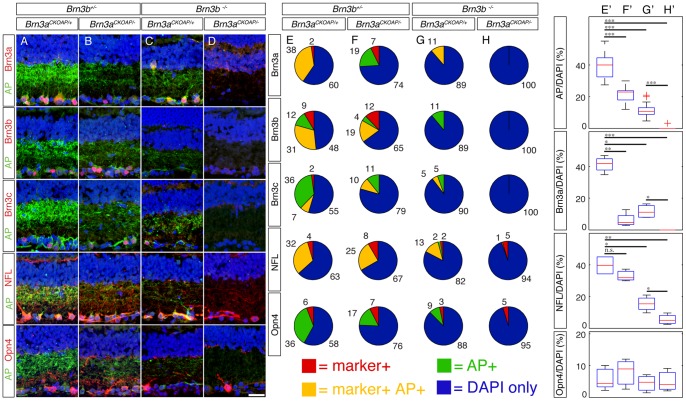
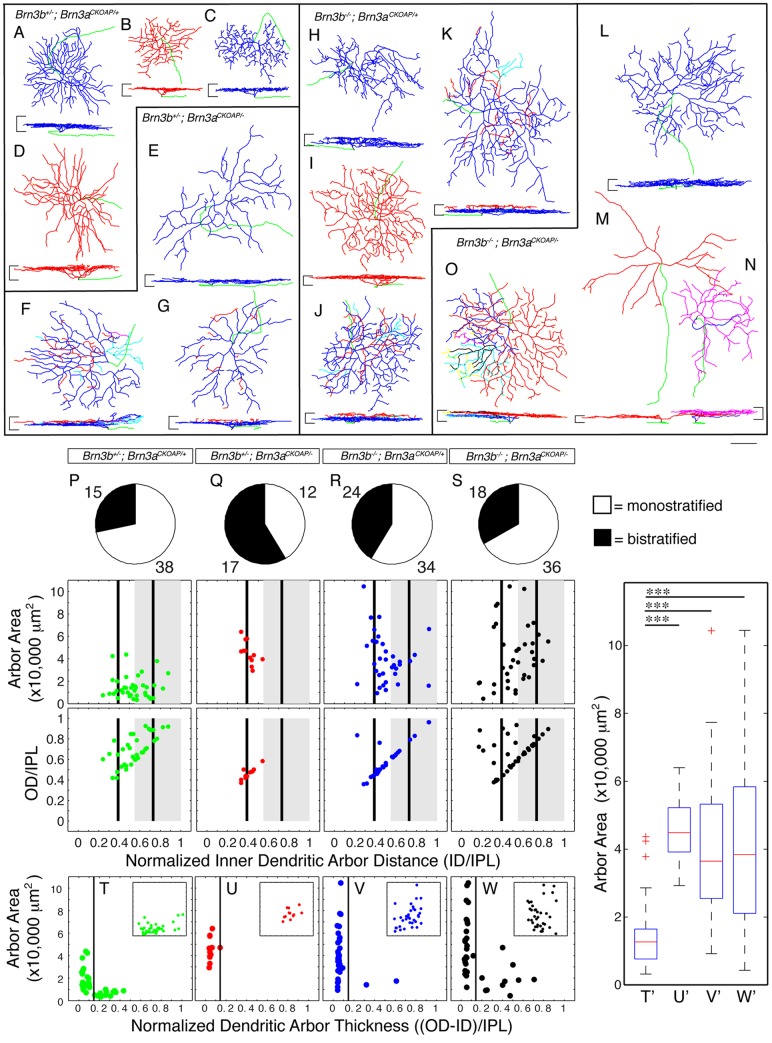
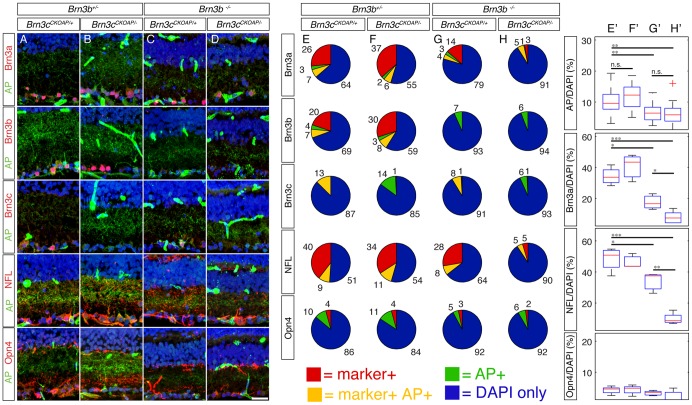
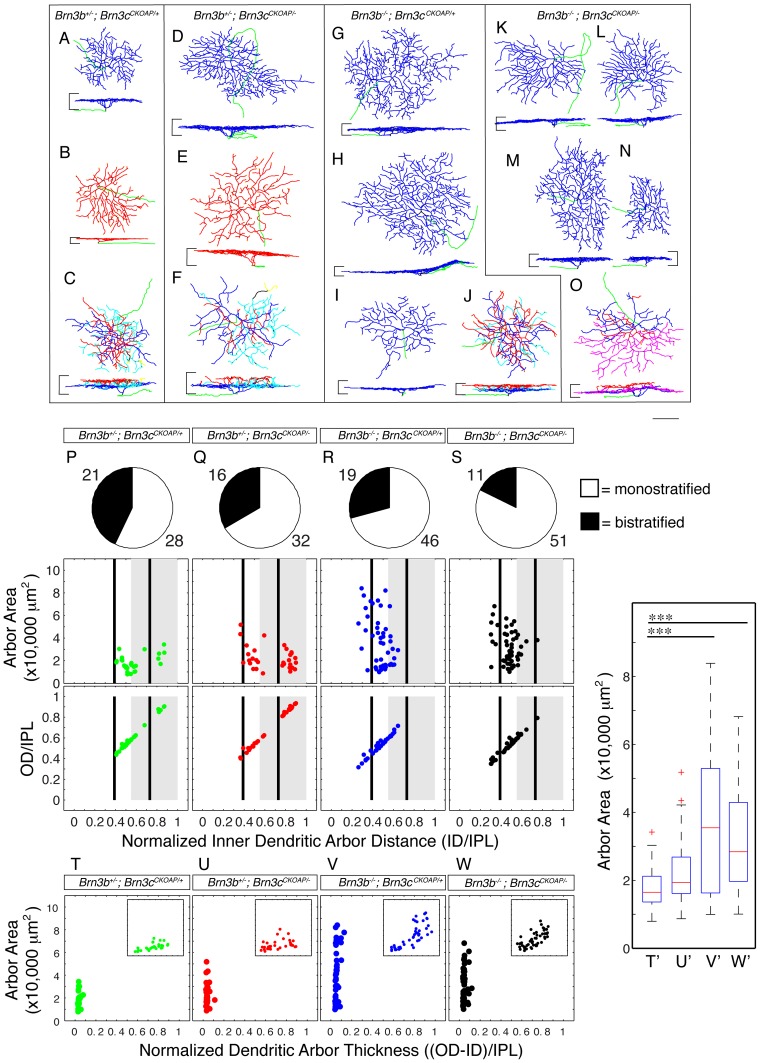
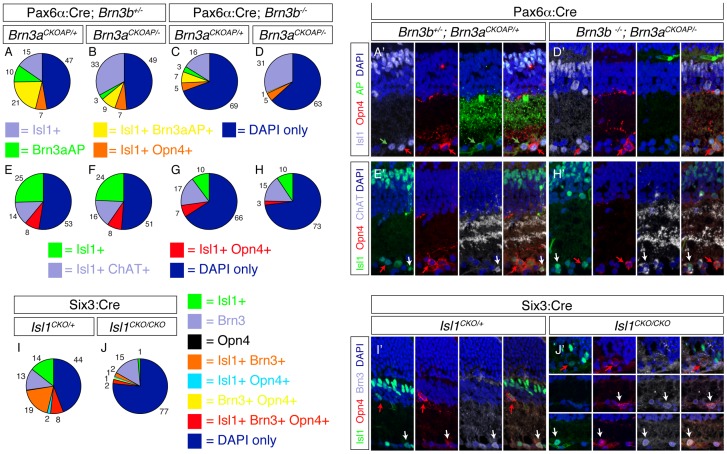
Methods and findings: We now have investigated genetic interactions between Brn3 transcription factors with respect to RGC development, by crossing conventional knock-out alleles of each Brn3 gene with conditional knock-in reporter alleles of a second Brn3 gene, and analyzing the effects of single or double Brn3 knockouts on RGC survival and morphology. We find that Brn3b loss results in axon defects and dendritic arbor area and lamination defects in Brn3a positive RGCs, and selectively affects survival and morphology of specific Brn3c (Pou4f3) positive RGC types. Brn3a and Brn3b interact synergistically to control RGC numbers. Melanopsin positive ipRGCs are resistant to combined Brn3 loss but are under the transcriptional control of Isl1, expanding the combinatorial code of RGC specification.

Conclusions: Taken together these results complete our knowledge on the mechanisms of transcriptional control of RGC type specification. They demonstrate that Brn3b is required for the correct development of more RGC cell types than suggested by its expression pattern in the adult, but that several cell types, including some Brn3a, Brn3c or Melanopsin positive RGCs are Brn3b independent.


Conflict of interest statement

Competing Interests: The authors have declared that no competing interests exist.

Figures

Figure 1
Figure 1. Generation and strategy of analysis of Brn3 double knock-out RGCs and controls.
A–C, Crosses resulting in either Brn3b−/−; Brn3aCKOAP/− (A), Brn3b−/−; Brn3cCKOAP/− (B), or Brn3c−/−; Brn3aCKOAP/− (C) retinas, and appropriate double heterozygote and single Brn3 knock-out controls. For each cross the parents are indicated on the left, and the four possible types of offspring on the right. D, Diagram of retina flat mount preparation of a Pax6α: Cre mouse. In the gray shaded temporal (T), and nasal (N) areas, Cre protein is expressed in all retinal precursors, beginning with embryonic day 10, before the first RGCs start to express any Brn3. In the dorsal to ventral (D–V) oriented white sector, Cre is expressed only in a minority of cells, allowing for visualization of single cell morphologies, as shown in G – J'', and Figures 2, 3 and 4. Stippled line indicates orientation of sections for Indirect Immunofluorescence (IIF), presented in Figures 5, 7 and 9. E–F, Parameters used for single cell analysis of Brn3AP RGCs, described in Figures 6,8. E, Extent of dendritic arbor lamination within the Inner Plexyform Layer (IPL) is quantified as distance between the Ganglion Cell Layer (GCL) and the inner (ID) and outer (OD) limits of the dendritic arbor and normalized to the thickness of the IPL, to yield normalized inner (ID/IPL) and outer (OD/IPL) distance. F, Dendritic arbor area in the flat mount perspective. G–J'', Nomarsky (DIC) images of individual Brn3AP RGCs from the area of sparse Cre recombination. Sequential pictures in the focal plane of the cell body and axon (G, H, I, J) or the single (G', H') or double dendritic arbors (I', I'', J', J'') are shown. Genoypes are: Pax6α: Cre; Brn3b+/+; Brn3aCKOAP/+ (G–G'), Pax6α: Cre; Brn3b−/−; Brn3cCKOAP/+ (H–H'), Pax6α: Cre; Brn3b+/+; Brn3cCKOAP/+ (I-I'-I''), Pax6α: Cre; Brn3b−/−; Brn3aCKOAP/− (J-J'-J''). Arrowheads point at cell bodies (black), axon (red), and dendrites in two different focal planes (green and blue, in J' – J''). Arrows in I point at faintly stained Brn3cAP RGC cell bodies. Scale bar in J'' = 50 μm.
Figure 2
Figure 2. Distinct degrees of RGC loss in mice mutant for either one or two of the three Brn3 transcription factors.
For each genotype (A–L), AP histochemistry of retina flat mount preparations (top) and insets covering the area of sparse recombination (bottom) are shown. AP staining is derived from Brn3aAP RGCs in retinas A–D and I–L, and from Brn3cAP RGCs in E–H. Genotypes and numbers of mice analyzed (n) are as follows: (A) – Pax6α: Cre; Brn3b+/−; Brn3aCKOAP/+, n = 5 (B) – Pax6α: Cre; Brn3b+/−; Brn3aCKOAP/−, n = 5 (C) – Pax6α: Cre; Brn3b−/−; Brn3aCKOAP/+, n = 3 (D) – Pax6α: Cre; Brn3b−/−; Brn3aCKOAP/−, n = 4 (E) – Pax6α: Cre; Brn3b+/−; Brn3cCKOAP/+, n = 2 (F) – Pax6α: Cre; Brn3b+/−; Brn3cCKOAP/−, n = 3 (G) – Pax6α: Cre; Brn3b−/−; Brn3cCKOAP/+, n = 4 (H) – Pax6α: Cre; Brn3b−/−; Brn3cCKOAP/−, n = 5 (I) – Pax6α: Cre; Brn3c+/−; Brn3aCKOAP/+, n = 3 (J) – Pax6α: Cre; Brn3c+/−; Brn3aCKOAP/−, n = 4 (K) – Pax6α: Cre; Brn3c−/−; Brn3aCKOAP/+, n = 4 (L) – Pax6α: Cre; Brn3b−/−; Brn3aCKOAP/−, n = 3. Significant numbers of Brn3aAP RGCs are present in double heterozygote (A), Brn3a (B) and Brn3b (C) single knockout retinas, but are almost completely absent from Brn3a – Brn3b DKO retinas (D). Arrow in C points at tangentially arranged axon arbors. Arrow in D points at the few remaining axons tracking to optic disc. Brn3b−/− retinas exhibit dramatic losses of Brn3cAP RGCs (G and H), however additional removal of Brn3c (compare H to G) does not result in a larger loss of Brn3cAP RGCs. Note that a large number of weakly AP positive RGC cell bodies can be seen in the inset in F. Arrow in G points at an abnormal axon tracking through the sparse region before returning towards the optic disc. Axon guidance defects as seen in C and G are present in all Brn3b−/− retinas analyzed in this study, and are reminiscent of the ones previously published. No distinct effects on Brn3aAP RGCs can be observed when Brn3c is deleted either alone (J) or in combination with Brn3a (L). Scale bars in L are 1 mm (black) for retina and 250 μm (white) for inset.
Figure 3
Figure 3. RGC axon projections to retinorecipient areas of the brain are differentially affected by loss of pairwise combinations of two Brn3 transcription factors.
Columns A–L represent coronal sections through the brains of mice with identical genotypes to the ones presented in Figure 1 A–L. For each genotype, trajectories of Brn3AP RGCs through five distinct stations of the optic nerve and tract are shown: (i) optic chiasm (oc) and Suprachiasmatic Nucleus (SCN), (ii) optic tract (ot), ventral Lateral Geniculate Nucleus (vLGN), Intergeniculate Leaflet (IGL), dorsal Lateral Geniculate Nucleus (dLGN), optic brachium (ob), Olivary Pretectal Nucleus (OPN), (iii) Caudal Pretectal Area (PA), Dorsal Terminal Nucleus (DTN), and Lateral Terminal Nucleus (LTN), (iv) Medial Terminal Nucleus (MTN), and (v) Superior Colliculus (SC). Nuclei are in capital letters, and axon tracts are in lower case. Consistent with RGC losses in the retina, only combined loss of Brn3a and Brn3b results in a complete removal of RGC axons from all portions of the optic path and retinorecipient nuclei (A–D). A'– D', Ventral views of unstained whole mouse brains with same genotypes as A–D. Note the reductions in optic nerve (green arrow) diameters and thickness and position of the optic chiasm (blue arrow) in Brn3b KO (C') and Brn3a-Brn3b DKO (D') mice. Brn3cAP RGC projections to all targets (dLGN and SC) are equally reduced in the absence of Brn3b (G) or combined deletion of Brn3b and Brn3c (H). Similar data were obtained from all mice of all genotypes as described all in Fig. 2. Scale bar in L = 1 mm.
Figure 4
Figure 4. Total RGC numbers are significantly reduced by combined ablation of Brn3a and Brn3b.
Overall numbers of RGCs were estimated by retrograde labeling of cell bodies with DiI crystals placed on the optic nerve stump, about 0.5(materials and methods). A–D, Flat mounts from (A) – Brn3b +/−; Brn3a CKOAP/+, n = 4, (B) – Brn3b +/−; Brn3a CKOAP/−, n = 4 (C) – Brn3b −/−; Brn3a CKOAP/+, n = 3 (D) – Brn3b −/−; Brn3a CKOAP/−, n = 4 retinas were oriented as schematized in (E). E, To standardize cell counts, temporal (T), dorsal (D), and nasal (N) 1 mm2 square images were taken, aligned to the outer edges of the tissue. White sector denotes the area of the retina in which only the Brn3b gene is ablated, whereas gray zones coincide with the expression domain of the Pax6α: Cre transgene, and hence both Brn3b and Brn3a gene copy numbers are being manipulated. A'– D', Insets, left panel, and box whisker plots, right panel, from the three quadrants shown in (E), demonstrate incremental loss of RGC cell bodies correlating with gene loss of function for Brn3a (B'), Brn3b (C') or both (D'). The box-whiskers plots for each of the three locations (temporal, dorsal, nasal) and four genotypes (A'–D') are shown. Note that, in Brn3b−/− only retinas (C'), total RGC numbers are dramatically reduced in all three analyzed quadrants, whereas in Brn3aCKOAP/− retinas (B'), RGC numbers are significantly reduced only in the temporal and nasal quadrants, where the Pax6α: Cre transgene is expressed and hence both copies of the Brn3a gene are removed in a nearly complete fashion. Whereas Brn3b ablation has the most dramatic effect on RGC loss (compare A' to C'), additional ablation of Brn3a further reduces the total number of RGCs (compare C' to D'). Horizontal bars in panels A'–D' denote pairs tested for significance by t tests (significance levels *p<0.05, **p<0.005, **p<0.001). RGC density averages, expressed as cells/mm2, are: for the temporal quadrants A' = 1537.16, B' = 706.51, C' = 132.42 and D' = 29.34; for the dorsal quadrants A' = 1038.32, B' = 963.83, C' = 231.74 and D' = 112.86; for the nasal quadrants A' = 1297.90, B' = 805.82, C' = 96.31 and D' = 33.86. Scale bars are 1 mm in d and 50 μm in D'.
Figure 5
Figure 5. Cumulative RGC loss in Brn3a – Brn3b double KO retinas is confirmed by drastic reduction in other general RGC markers.
Retinal sections cut in a naso-temporal plane, as shown in Figure 1D, where stained with antibodies against AP and a variety of markers. Imaged and quantitated regions fall within the Pax6α: Cre full recombination domain. Genotypes indicated at the top are the same as the ones seen in Fig. 2A–D. A–D, examples of retinas from the four genotypes stained with antibodies against AP and various RGC markers, as quantitated in E–H. E–H, Pie charts represent quantitations of Brn3aAP RGCs stained for AP in conjunction with either antibodies against the Brn3a (row 1), Brn3b (row 2) or Brn3c (row3) proteins or the RGC markers Neurofilament Light chain (NFL, row 4) and Melanopsin (Opn4, row 5). To normalize the observed frequencies of AP only (green), marker only (red), or double positive cells (yellow), the number of DAPI only cells in the GCL is included (blue). Numbers next to the pie sectors are percent of total. E'–H', box whisker plots for relative densities of four RGC markers in the GCL, for the same experiments and genotypes presented in E–H. For Brn3a, NFL and Opn4, 4–7 sections from 2–3 mice were analyzed for each marker and genotype; for AP, 16–21 sections have been quantitated for each genotype. Marker density averages, expressed as Marker/DAPI cells in GCL, are: AP: E' = 39.08%, F' = 21.21%, G' = 11.54% and H' = 0.20%; Brn3a: E' = 41.31%, F' = 6.2%, G' = 11.62% and H' = 0.00%; NFL: E' = 39.64%, F' = 33.04%, G' = 15.4%, and H' = 5.55%; Opn4: E' = 5.84%, F' = 7.83%, G' = 4.43%, and H' = 5.04% (significance levels *p<0.05, **p<0.005, **p<0.001). Note that retinas lacking both Brn3a and Brn3b are completely devoid of Brn3aAP RGCs, Brn3a, Brn3b and Brn3c, but preserve a few NFL and Opn4 positive RGCs, representing each about 5% of DAPI positive cells in the GCL (a–d, rows 4 and 5). Scale bar in D is 25 μm.
Figure 6
Figure 6. Distinct morphological defects in Brn3aAP RGCs missing either Brn3a, Brn3b or both transcription factors.
A–O, morphological reconstructions of Brn3aAP RGCs from the area of sparse recombination in retinas of genotypes identical to Fig. 2A–D (for numbers of mice for each genotype, see Fig. 2). For each indicated genotype, several examples are shown, surrounded by black outlines. For each individual RGC, en face (top) and vertical view (bottom) are shown. Stratification levels for each cell can be compared to the GCL and INL limits of the IPL, shown as horizontal black lines at the sides of the vertical view. Axons are shown in green, ON stratifying dendrites in blue and OFF stratifying dendrites in red. In bistratified RGCs, cyan, magenta, black and yellow are used for “recurrent dendrites” which originate from the OFF plexus, and cross between to the ON and then OFF plexuses, several times. Scale bar is 50 μm. P–W, Quantitations of morphological parameters for Brn3aAP RGCs. For each indicated genotype, top panels are pie charts of bistratified (blue) vs. monostratified (red) RGCs. For each genotype, the number of cells of each type is indicated. Middle and bottom panels contain morphological parameters for monostratified RGCs. Middle panels show scatter plots of vitread dendritic arbor lamination limit (ID/IPL, x axis) vs. dendritic arbor area (y axis) and bottom panels vitread vs sclerad dendritic arbor lamination limits (ID/IPL, x axis vs. OD/IPL, y axis). Black vertical bars representing the stratification levels of ' 'ON'' (0.39 ID/IPL) and “FF” (0.73 ID/IPL) starburst amacrine cells, and a gray rectangle spanning 0.55–1.0 ID/IPL representing the “FF” sublamina of the IPL serve as theoretical stratification landmarks derived from literature (see Badea & Nathans 2011). T–W, the extent of lamination depth of monostratified dendritic arbors within the IPL is expressed normalized dendritic arbor thickness, and plotted against arbor area. Vertical lines at 0.15 thickness separate large, flat dendritic arbors on the left, from small and thick dendritic arbors on the right. In each panel, the insets show data for excentricity of the cell body (x axis) plotted against dendritic arbor area (y axis), showing little correlation between the two parameters. For a detailed explanation of these parameters, see Materials and Methods, Fig. 1 e, f and Badea et al, 2004, 2009 or 2011. A significant increase in dendritic arbor area, and striking depth of lamination defects can be observed in Brn3aAP RGCs missing either Brn3b or both Brn3a and Brn3b. T'–W' represent box-whisker plots for dendritic arbor areas of monostratified RGCs of same genotypes as T–W. RGC dendritic arbor area averages, in μm2, are: T' = 14,799, U' = 45,330, V' = 39,665 and W' = 43,147 (significance ***p<0.001).
Figure 7
Figure 7. Selective RGC loss in Brn3b – Brn3c double KO retinas documented by losses of general RGC markers.
Retinal sections cut in a naso-temporal plane, as shown in Figure 1D, where stained with antibodies against AP and a variety of markers. Imaged and quantitated regions fall within the Pax6α: Cre full recombination domain. Genotypes indicated at the top are the same as the ones seen in Fig. 2E–H. A–D, examples of retinas from the four genotypes stained with antibodies against AP and various RGC markers, as quantitated in E–H. E–H, Pie charts represent quantitations of Brn3cAP RGCs stained for AP in conjunction with either antibodies against the Brn3a (row 1), Brn3b (row 2) or Brn3c (row3) proteins or the RGC markers Neurofilament Light chain (NFL, row 4) and Melanopsin (Opn4, row 5). To normalize the observed frequencies of AP only (green), marker only (red), or double positive cells (yellow), the number of DAPI only cells in the GCL is included (blue). Numbers next to the pie sectors are percent of total. E'–H' box whisker plots for relative densities of four RGC markers in the GCL, for the same experiments and genotypes presented in E–H. For Brn3a, NFL and Opn4, 3–7 sections from 2–3 mice were analyzed for each marker and genotype; for AP, 17–22 sections have been quantitated for each genotype. Marker density averages, expressed as Marker/DAPI cells in GCL, are: AP: E' = 10.18%, F' = 11.63%, G' = 6.57% and H' = 6.16%; Brn3a: E' = 34.34%, F' = 40.65%, G' = 17.6% and H' = 8.26%; NFL: E' = 48.47%, F' = 46.41%, G' = 34.03%, and H' = 9.86%; Opn4: E' = 4.21%, F' = 4.36%, G' = 3.3%, and H' = 1.77% (significance levels *p<0.05, **p<0.005, **p<0.001). Note that retinas lacking Brn3b alone, or in conjunction with Brn3c have preserved AP positivity only in a restricted lamina in the centre of the IPL. Brn3a and NFL, show cumulative losses in Brn3b–Brn3c DKO retinas when compared to Brn3b single KO. Scale bar in D is 25 μm.
Figure 8
Figure 8. Loss of Brn3b results in specific ablation of “OFF” Brn3cAP RGCs and significant increase in “ON” Brn3cAP RGCs dendritic arbor areas.
A–O, Morphological reconstructions of Brn3cAP RGCs from the area of sparse recombination in retinas of genotypes identical to Fig. 2E–H (for numbers of mice for each genotype, see Fig. 2). For each indicated genotype, several examples are shown, surrounded by black outlines. Scale bar is 50 μm. P–W, Quantitations of morphological parameters for Brn3cAP RGCs. The conventions for graphic representations, depicted morphologies and quantitated parameters are as described in Fig. 6. T–W, the extent of lamination depth of dendritic arbors within the IPL is expressed normalized dendritic arbor thickness, and plotted against arbor area. In each panel, the insets show data for excentricity of the cell body (x axis) plotted against dendritic arbor area (y axis), showing significant correlation between the two parameters. Note that “OFF” Brn3cAP RGCs identified as red dendritic arbors in the reconstructions, and data points in between the “OFF” black line and the right (outer) edge of the “OFF” IPL in the scatter plots are completely missing from retinas mutant for Brn3b alone or Brn3b and Brn3c. In retinas from these genotypes, “ON” Brn3cAP RGCs, marked as blue dendritic arbors in the reconstructions, and data points in between the “ON” and “OFF” black lines in the scatter plots, exhibit a marked increase in area. T'–W' represent box-whisker plots for dendritic arbor areas of monostratified RGCs of same genotypes as T–W. RGC dendritic arbor area averages, in μm2, are: T' = 17736, U' = 22325, V' = 37548 and W' = 31622 (significance ***p<0.001).
Figure 9
Figure 9. A population of ipRGCs, which survive combined loss of Brn3a and Brn3b, might be transcriptionally regulated by Isl1.
A–D', Retinal sections from genotypes identical to Fig. 2 A–D were triple stained for Isl1, Opn4 and Brn3aAP. A–D, Pie charts showing relative frequencies of single and double stained cells. No Opn4+ only, Brn3aAP+ Opn4+ or triple labeled cells were observed. A',D', Examples of stainings quantitated in A and D show each fluorescent channel merged to DAPI, (panels 1–3) and all channels merged in 4. Note colocalization of Isl1 with either Brn3aAP (green arrow) or Opn4 (red arrow). E–H', Quantitation (E–H) and examples (E', H') of retinal sections triple stained for Isl1, Opn4 and ChAT. Note that Isl1+ (RGCs) and Isl1+ Opn4+ (ipRGCs – red arrows) cells are reduced in numbers in Brn3b KO or Brn3a–Brn3b DKO retinas, but Isl1+ ChAT+ (Starburst amacrines – white arrows) frequencies remain relatively unaffected. I–J', Retinal sections triple stained for Isl1, Opn4 and Brn3. One example from Six3: Cre; Isl1 CKO/+ control (I') and three examples from Six3: Cre; Isl1 CKO/CKO (J') mice are shown. Green, red and white arrows point at double labeled cells. I, J pie charts of single, double or triple labeled cells. Note that, in Isl1 KO retinas, total Brn3+ RGCs are reduced to about half and Opn4+ cells are essentially missing. A total of 9 sections for Six3: Cre; Isl1 CKO/+ control and 11 sections from Six3: Cre; Isl1 CKO/CKO mice were analyzed. Mean Opn4/DAPI ratios were 10.63% for Six3: Cre; Isl1 CKO/+ and 0.63% for Six3: Cre; Isl1 CKO/CKO (t test p value  = 2.4 e-7). In Six3: Cre; Isl1CKO/CKO retinas rare Isl1+ are observed as result of a low level of mosaicism of the Six3: Cre transgene. Some of these are also Opn4 positive, as seen in panel J', top and bottom row. Scale bar in J' is 25 μm.

Similar articles

Cited by

References

    1. Levick WR (1975) Form and function of cat retinal ganglion cells. Nature 254: 659–662. - PubMed
    1. Masland RH (2001) Neuronal diversity in the retina. Curr Opin Neurobiol 11: 431–436. - PubMed
    1. Troy JB, Shou T (2002) The receptive fields of cat retinal ganglion cells in physiological and pathological states: where we are after half a century of research. Prog Retin Eye Res 21: 263–302. - PubMed
    1. Wassle H (2004) Parallel processing in the mammalian retina. Nat Rev Neurosci 5: 747–757. - PubMed
    1. Field GD, Chichilnisky EJ (2007) Information processing in the primate retina: circuitry and coding. Annu Rev Neurosci 30: 1–30. - PubMed

Publication types

MeSH terms