. 2013 Oct 8;8(10):e76675.
doi: 10.1371/journal.pone.0076675. eCollection 2013.

Role of key salt bridges in thermostability of G. thermodenitrificans EstGtA2: distinctive patterns within the new bacterial lipolytic enzyme subfamily XIII.2 [corrected]

Affiliations

Role of key salt bridges in thermostability of G. thermodenitrificans EstGtA2: distinctive patterns within the new bacterial lipolytic enzyme subfamily XIII.2 [corrected]

David M Charbonneau et al. PLoS One. .

Erratum in

Abstract

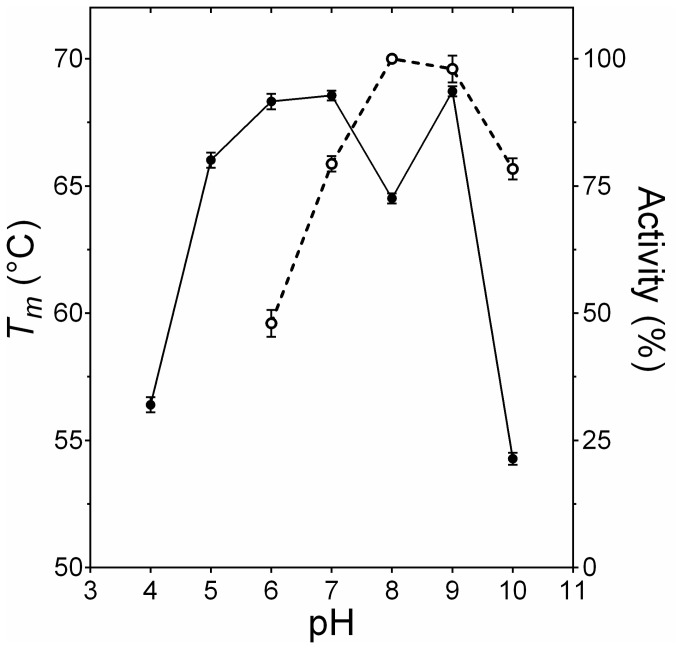
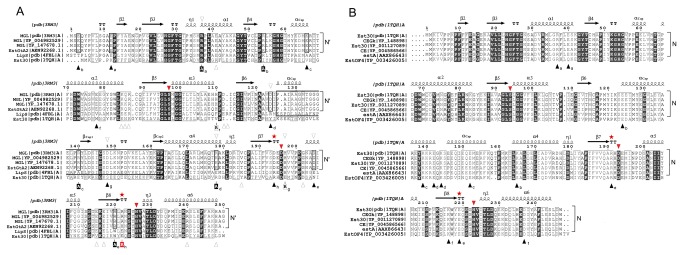
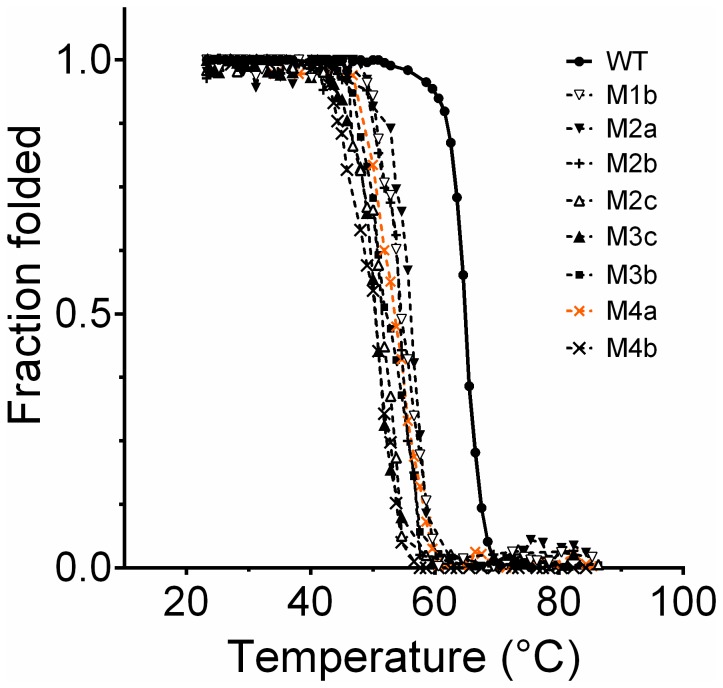
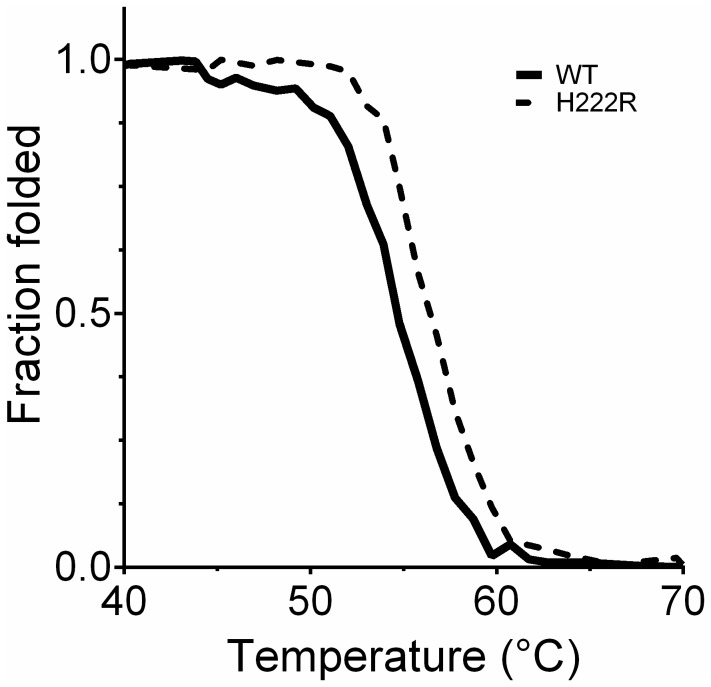
Bacterial lipolytic enzymes were originally classified into eight different families defined by Arpigny and Jaeger (families I-VIII). Recently, the discovery of new lipolytic enzymes allowed for extending the original classification to fourteen families (I-XIV). We previously reported that G. thermodenitrificans EstGtA2 (access no. AEN92268) belonged to a novel group of bacterial lipolytic enzymes. Here we propose a 15(th) family (family XV) and suggest criteria for the assignation of protein sequences to the N' subfamily. Five selected salt bridges, hallmarks of the N' subfamily (E3/R54, E12/R37, E66/R140, D124/K178 and D205/R220) were disrupted in EstGtA2 using a combinatorial alanine-scanning approach. A set of 14 (R/K→A) mutants was produced, including five single, three double, three triple and three quadruple mutants. Despite a high tolerance to non-conservative mutations for folding, all the alanine substitutions were destabilizing (decreasing T m by 5 to 14°C). A particular combination of four substitutions exceeded this tolerance and prevents the correct folding of EstGtA2, leading to enzyme inactivation. Although other mutants remain active at low temperatures, the accumulation of more than two mutations had a dramatic impact on EstGtA2 activity at high temperatures suggesting an important role of these conserved salt bridge-forming residues in thermostability of lipolytic enzymes from the N' subfamily. We also identified a particular interloop salt bridge in EstGtA2 (D194/H222), located at position i -2 and i -4 residues from the catalytic Asp and His respectively which is conserved in other related bacterial lipolytic enzymes (families IV and XIII) with high tolerance to mutations and charge reversal. We investigated the role of residue identity at position 222 in controlling stability-pH dependence in EstGtA2. The introduction of a His to Arg mutation led to increase thermostability under alkaline pH. Our results suggest primary targets for optimization of EstGtA2 for specific biotechnological purposes.


Conflict of interest statement

Competing Interests: The authors have declared that no competing interests exist.

Figures

Figure 1
Figure 1. Activity and stability dependence on pH for EstGtA2.
The apparent melting temperatures (derived from CD) as function of pH are shown as closed circles. Open circles show relative activity (hydrolysis of pNP-octanoate) at different pH values at 50°C (optimal temperature). Standard deviations for T m ranged between 0.1-0.3°C and do not exceeded 5% for activity. Buffers used were sodium citrate/citric acid (pH4-5), sodium phosphate (pH 6-8), Tris-HCl (pH 9) and CAPS/NaOH (pH 10-11).
Figure 2
Figure 2. Structure model of EstGtA2.
Ribbon structure of EstGtA2 based on the X-ray crystal structure of MGL H-257 (left). The beta sheet is shown in purple and the seven strands are identified as β2-β8, alpha helices are in grey and identified as α1-α6. The cap domain (residues 125-161) is shown in green. The separate conserved helix completing the cap structure is shown. The catalytic triade S97, D196, H226 is shown as red sticks and the interloop salt bridge position (catalytic loops) harbouring the tolerant salt bridge is shown in red. Right panel shows a structural alignment of EstGtA2 model (white) and MGL H-257 crystal structure (3RM3) in light green. The corresponding ribbon structures are almost perfectly superimposed and shown with a 90° rotation view compared to left model. The five salt bridges studied and exclusive to the N’ subfamily are shown (E3-R54, E12-R37, E66-R140, D124-K178 and D205-R220) as sticks. The five basic residues studied by combinatorial mutagenesis are labelled in bold. The interloop salt bridge conserved in (i -2, i -4) from the catalytic Asp and His residues respectively is identified by an arrow (D194-H222 in EstGtA2) and (D194-R222 for MGL H-257).
Figure 3
Figure 3. Distinctive salt bridge patterns conserved within family XV and XIII.
Panel A: Multiple sequence alignment for N’ subfamily enzymes (MGL from Bacillus sp. H-257, G. thermoleovorans, G. kaustophilus and EstGtA2 from G. thermodenitrificans) and representative of the LipS (4FBL) and N subfamily (1TQH). The secondary structure elements from MGL H-257 (3RM3) are shown on top. The cap domain is boxed (thick line). Residue numbering is based on EstGtA2 and MGL H-257. The residues of the catalytic triad are identified by a triangle above the MSA. The seven N’ conserved salt bridges: E3-R54, E12-R37, E66-R140, H110-E78, D124-K178, H197-D148 and D205-R220 are identified by close triangles below the MSA with same letter. Residues shaved by alanine-scanning are identified by a black box below the MSA. Open triangles refer to LipS salt bridges pattern. The tolerant interloop salt bridge located in (i -2, i -4) from the catalytic Asp and His respectively is identified with a red star above the MSA. The alanine or arginine substitutions are indicated by a box A or R. Panel B: Multiple sequences alignment of N-related subfamily enzymes, compared to LipS and MGL (from N’ subfamily). Six exclusive salt bridges are identified by arrows: R37-E40, E124-K165, K139-E152, E142-K144, R191-E219 and K216-D237. Numbering is based on Est30 (1TQH).
Figure 4
Figure 4. Distinctive salt bridge patterns conserved in related lipolytic enzymes.
Structural comparison of the salt bridges content for EstGtA2 (A) LipS (4FBL) (B) and Est30 (1TQH) (C) is shown. At variance with the conserved interloop bridge, the 5 selected salt bridges in EstGtA2 are absent in LipS- and N-related enzymes. Residues exclusive to the N’ subfamily and studied by alanine-scanning mutagenesis are shown in red. Structure of the cap domain is shown in dark gray. The conserved helix of the cap between the three structures is identified. LipS structure share features from N’ and from N subfamilies. The arrow shows salt bridge conserved between EstGtA2 and LipS. The residues forming the interloop salt bridge are shown and identified on the respective structures.
Figure 5
Figure 5. Evolution of the interloop salt bridge near the active site.
A phylogenetic analysis of bacterial lipolytic enzymes related to family XV and XIII on the separation of the N’ and N subfamilies. Sequences with solved crystal structures displaying the interloop salt bridge located in (i -2, i -4) from the catalytic Asp and His respectively are shown in bold. The corresponding ion pairs are shown right to the tree and annotated with a star and position relative to catalytic residues. Numbers show percentage identity compared with EstGtA2. Dashed lines indicate polarity reversals observed at the conserved interloop salt bridge position. The cap structure is indicated for X-ray resolved lipolytic enzymes. Sequences were assigned to N,N’and abH11 families (taking into account enzymes classification in Lipase Engineering Database). The phylogenetic and molecular evolutionary analyses were conducted using MEGA version 5. The evolutionary history was inferred using the neighbor-joining method and the evolutionary distances were computed using the Poisson correction and are in the same units of the number of amino acid substitutions per site.
Figure 6
Figure 6. Activity profile for wild type and mutants.
Specific activity (µmol min-1 mg-1) was measured from 25 to 65°C for the wild type and mutants in 20 mM sodium phosphate pH 8 using pNP-octanoate as substrate. The initial rates (V0) were measured below substrate saturation and than reflect K cat/K m conditions. Each point (specific activity values) was obtained from three different experiments and reported relative to wild type at 50°C (optimal conditions). Standard deviations do not exceed 5%. The wild type is shown as close circles and bold line. The curve for the quadruple mutant M4a is shown in orange and in red for M4c. The mutation R37A enhances the activity and shift the optimal temperature compared to wild type, the relative activity at 25 versus 60°C are listed in Table 1.
Figure 7
Figure 7. Conformational analysis by far-UV circular dichroism.
Far-UV CD spectra were recorded at 25°C with 0.5 mg/ml of protein in 20 mM sodium phosphate pH 8. The wild type is shown in thick black lines. Left panel shows that most mutants are folded. Right panel shows misfolding of M4c. The quadruple mutant M4c spectra (red curves) were similar to spectra of unfolded EstGtA2 (WT U), wild type spectra recorded at 90°C.
Figure 8
Figure 8. Conformational analysis by near-UV circular dichroism.
Near-UV CD spectra were recorded at 25°C with 0.5 mg/ml of protein in 20 mM sodium phosphate pH 8. While all mutants had a strong minimum at 292 nm, M4c (red curve) had a weak signal throughout the range studied, suggesting loss of packing near aromatic residues.
Figure 9
Figure 9. Thermal unfolding of EstGtA2 and mutants.
Thermal unfolding curves recorded from 25 to 90°C were expressed as fraction folded derived from the CD signal at 222 nm as function of temperature. Samples were made of 0.5 mg/ml of protein in 20 mM sodium phosphate pH 8. EstGtA2 had the highest denaturation temperature among all versions studied. The quadruple mutant M4b is the least stable. The quadruple mutant M4a is shown in orange.
Figure 10
Figure 10. Intrinsic fluorescence.
Panel A: Fluorescence spectra recorded for WT, M3c and M4c (red curves) at 25°C with 0.1 mg/ml at pH 8 in the same buffer (top spectra), and with 3 M GuHCl (bottom spectra). Panel B: Corresponding chemical denaturation curves are shown. Fluorescence peak was shifted toward longer wavelength upon denaturation, indicating hydration of aromatics. M4c showed hydration of aromatics in the absence of denaturant.
Figure 11
Figure 11. Modification of the interloop salt bridge in EstGtA2.
The conserved inter-loop salt bridge found in EstGtA2 (D194-H222) was modified to resemble that of 3RM3 (D194-R222). Figure shows thermal unfolding curves calculated from the CD signal at 222 nm as function of temperature for the wild type enzyme and for the H222R mutant (protein concentration of 0.5 mg/ml in 20 mM CAPS pH 10). The mutation of H for R in position 222 led to increase the denaturation temperature by 2.1°C.
Figure 12
Figure 12. Impact of the new interloop salt bridge on EstGtA2 thermostability under alkaline pH.
A. Structural alignment of the interloop portion for Est30 (blue) and LipS (pink). B. Structural alignment for MGL-H257 (green) and EstGtA2 (white), salt bridge at the conserved interloop position is shown for respective structures. Arrow shows change reversal for MGL-H257 and EstGtA2 (N’ enzymes). The proteins (wild type or H222R mutant) were incubated for 10 min at the indicated temperature and the residual activity on pNP-octanoate (compared with non-incubated enzymes) was measured at 25°C in 20 mM CAPS buffer pH 10.

Similar articles

Cited by

References

    1. Ollis DL, Cheah E, Cygler M, Dijkstra B, Frolow F et al. (1992) The alpha/beta hydrolase fold. Protein Eng 5(3): 197-211. doi:10.1093/protein/5.3.197. PubMed: 1409539. - DOI - PubMed
    1. Nardini M, Dijkstra BW (1999) α/β hydrolase fold enzymes: the family keeps growing. Curr Opin Struct Biol 9: 732-737. doi:10.1016/S0959-440X(99)00037-8. PubMed: 10607665. - DOI - PubMed
    1. Arpigny JL, Jaeger K-E (1999) Bacterial lipolytic enzymes: classification and properties. Biochem J 343: 177-183. doi:10.1042/0264-6021:3430177. PubMed: 10493927. - DOI - PMC - PubMed
    1. Rao L, Xue Y, Zheng Y, Lu JR, Ma Y (2013) A novel alkaliphilic Bacillus esterase belongs to the 13th bacterial lipolytic enzyme family. PLOS ONE 8(4): e60645. doi:10.1371/journal.pone.0060645. PubMed: 23577139. - DOI - PMC - PubMed
    1. Montoro-García S, Martínez-Martínez I, Navarro-Fernández J, Takami H, García-Carmona F et al. (2009) Characterization of a novel carboxylesterase from Geobacillus kaustophilus HTA426 shows the existence of a new carboxylesterase family. J Bacteriol 191(9): 3076-3085. doi:10.1128/JB.01060-08. PubMed: 19304850. - DOI - PMC - PubMed

Publication types

MeSH terms