Ulmus davidiana var. japonica Nakai upregulates eosinophils and suppresses Th1 and Th17 cells in the small intestine
- PMID: 24116141
- PMCID: PMC3792050
- DOI: 10.1371/journal.pone.0076716
Ulmus davidiana var. japonica Nakai upregulates eosinophils and suppresses Th1 and Th17 cells in the small intestine
Abstract
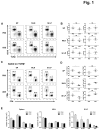
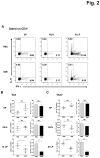
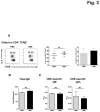
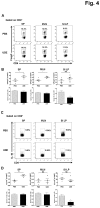
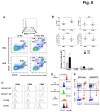
The bark of Ulmus davidiana var. japonica Nakai (Ulmaceae) has been used in traditional Korean medicine for chronic inflammation in the gastrointestinal tract. Here we investigated the frequency and cytokine profile of the major immune cells in the small intestinal lamina propria (SI LP), spleen, and mesenteric lymph nodes (MLNs) of mice treated orally with Ulmus davidiana var. japonica Nakai bark water extract (UDE) to address the immunomodulatory role of this herb in intestinal homeostasis. B6 mice were given 5g/kg UDE once daily for 14 days. They were then sacrificed, and cells were isolated from the spleen, MLNs, and SI LP. The proportion of B versus T lymphocytes, CD4(+) versus CD8(+) T lymphocytes, Th1 and Th17 cells, and Foxp3(+) regulatory T cells in the spleen, MLNs, and SI LP were analyzed. The frequency of antigen-presenting cells (APCs), including dendritic cells, macrophages, and eosinophils in the SI LP and the expression of costimulatory molecules on APCs were also evaluated. The numbers and frequencies of Th1 and Th17 cells in the SI LP were significantly reduced in the UDE-treated mice compared with PBS controls. In addition, the proportion of IL-4-producing eosinophils in the SI LP was significantly elevated in the UDE-treated mice compared with controls. Taken together, these data indicate that UDE up-regulates the number and frequency of SI LP eosinophils, which can down-regulate the Th1 and Th17 responses via IL-4 secretion and contribute to intestinal homeostasis.
Conflict of interest statement
Figures
Similar articles
-
Anti-inflammatory and immune-modulating effect of Ulmus davidiana var. japonica Nakai extract on a macrophage cell line and immune cells in the mouse small intestine.J Ethnopharmacol. 2013 Mar 27;146(2):608-13. doi: 10.1016/j.jep.2013.01.035. Epub 2013 Feb 4. J Ethnopharmacol. 2013. PMID: 23384785
-
Anti-Obesity and Lipid Metabolism Effects of Ulmus davidiana var. japonica in Mice Fed a High-Fat Diet.J Microbiol Biotechnol. 2021 Jul 28;31(7):1011-1021. doi: 10.4014/jmb.2102.02015. J Microbiol Biotechnol. 2021. PMID: 34099594 Free PMC article.
-
Preventative effect of an herbal preparation (HemoHIM) on development of airway inflammation in mice via modulation of Th1/2 cells differentiation.PLoS One. 2013 Jul 2;8(7):e68552. doi: 10.1371/journal.pone.0068552. Print 2013. PLoS One. 2013. PMID: 23844220 Free PMC article.
-
Protective effects of Ulmus davidiana var. japonica against OVA-induced murine asthma model via upregulation of heme oxygenase-1.J Ethnopharmacol. 2010 Jul 6;130(1):61-9. doi: 10.1016/j.jep.2010.04.011. Epub 2010 Apr 24. J Ethnopharmacol. 2010. PMID: 20420895
-
Years in Review: Recent Progress in Cellular Allergology.Int Arch Allergy Immunol. 2016;169(1):1-12. doi: 10.1159/000444753. Epub 2016 Mar 9. Int Arch Allergy Immunol. 2016. PMID: 26953825 Free PMC article. Review.
Cited by
-
Small intestinal eosinophils regulate Th17 cells by producing IL-1 receptor antagonist.J Exp Med. 2016 Apr 4;213(4):555-67. doi: 10.1084/jem.20141388. Epub 2016 Mar 7. J Exp Med. 2016. PMID: 26951334 Free PMC article.
-
Pharmacological Inhibition of N-Acylethanolamine Acid Amidase (NAAA) Mitigates Intestinal Fibrosis Through Modulation of Macrophage Activity.J Crohns Colitis. 2025 Feb 4;19(2):jjae132. doi: 10.1093/ecco-jcc/jjae132. J Crohns Colitis. 2025. PMID: 39211986 Free PMC article.
-
Regulation of Cytokines and Dihydrotestosterone Production in Human Hair Follicle Papilla Cells by Supercritical Extraction-Residues Extract of Ulmus davidiana.Molecules. 2022 Feb 19;27(4):1419. doi: 10.3390/molecules27041419. Molecules. 2022. PMID: 35209207 Free PMC article.
-
Regulatory Eosinophils in Inflammation and Metabolic Disorders.Immune Netw. 2017 Feb;17(1):41-47. doi: 10.4110/in.2017.17.1.41. Epub 2017 Feb 23. Immune Netw. 2017. PMID: 28261019 Free PMC article. Review.
References
Publication types
MeSH terms
Substances
LinkOut - more resources
Full Text Sources
Other Literature Sources
Research Materials
Miscellaneous

