

Permeability transition pore-mediated mitochondrial superoxide flashes regulate cortical neural progenitor differentiation
- PMID: 24116142
- PMCID: PMC3792897
- DOI: 10.1371/journal.pone.0076721
Permeability transition pore-mediated mitochondrial superoxide flashes regulate cortical neural progenitor differentiation
Abstract
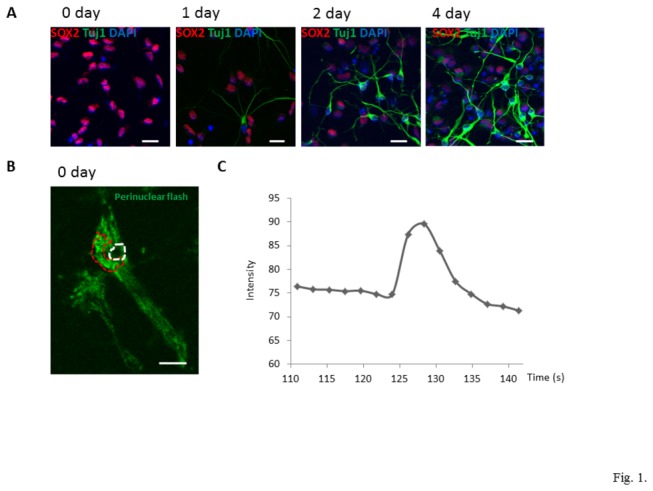
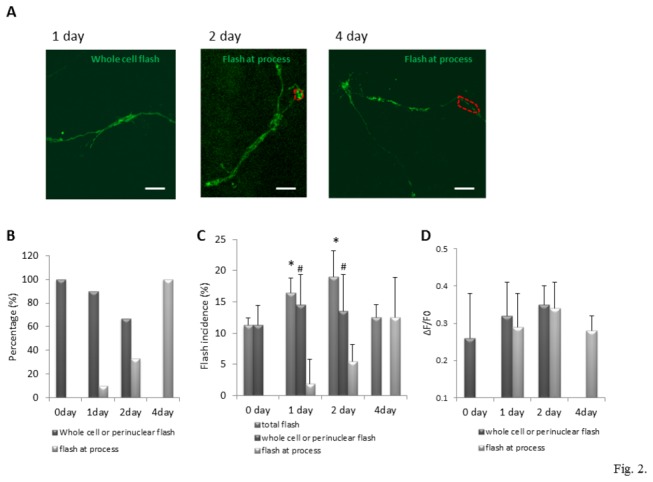
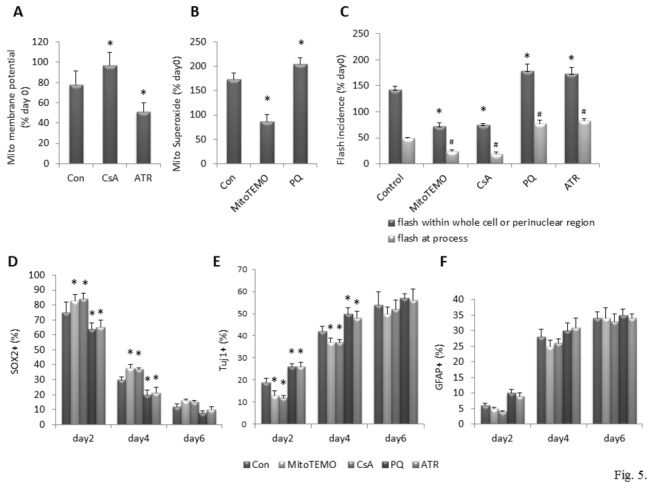
In the process of neurogenesis, neural progenitor cells (NPCs) cease dividing and differentiate into postmitotic neurons that grow dendrites and an axon, become excitable, and establish synapses with other neurons. Mitochondrial biogenesis and aerobic metabolism provide energy substrates required to support the differentiation, growth and synaptic activity of neurons. Mitochondria may also serve signaling functions and, in this regard, it was recently reported that mitochondria can generate rapid bursts of superoxide (superoxide flashes), the frequency of which changes in response to environmental conditions and signals including oxygen levels and Ca(2+) fluxes. Here we show that the frequency of mitochondrial superoxide flashes increases as embryonic cerebral cortical neurons differentiate from NPCs, and provide evidence that the superoxide flashes serve a signaling function that is critical for the differentiation process. The superoxide flashes are mediated by mitochondrial permeability transition pore (mPTP) opening, and pharmacological inhibition of the mPTP suppresses neuronal differentiation. Moreover, superoxide flashes and neuronal differentiation are inhibited by scavenging of mitochondrial superoxide. Conversely, manipulations that increase superoxide flash frequency accelerate neuronal differentiation. Our findings reveal a regulatory role for mitochondrial superoxide flashes, mediated by mPTP opening, in neuronal differentiation.
Conflict of interest statement
Figures
Similar articles
-
Permeability transition pore-mediated mitochondrial superoxide flashes mediate an early inhibitory effect of amyloid beta1-42 on neural progenitor cell proliferation.Neurobiol Aging. 2014 May;35(5):975-89. doi: 10.1016/j.neurobiolaging.2013.11.002. Epub 2013 Nov 13. Neurobiol Aging. 2014. PMID: 24325797 Free PMC article.
-
Mitochondrial superoxide production negatively regulates neural progenitor proliferation and cerebral cortical development.Stem Cells. 2012 Nov;30(11):2535-47. doi: 10.1002/stem.1213. Stem Cells. 2012. PMID: 22949407 Free PMC article.
-
Synergistic triggering of superoxide flashes by mitochondrial Ca2+ uniport and basal reactive oxygen species elevation.J Biol Chem. 2013 Feb 15;288(7):4602-12. doi: 10.1074/jbc.M112.398297. Epub 2013 Jan 2. J Biol Chem. 2013. PMID: 23283965 Free PMC article.
-
Superoxide flashes: elemental events of mitochondrial ROS signaling in the heart.J Mol Cell Cardiol. 2012 May;52(5):940-8. doi: 10.1016/j.yjmcc.2012.02.007. Epub 2012 Mar 1. J Mol Cell Cardiol. 2012. PMID: 22405973 Review.
-
Superoxide flashes, reactive oxygen species, and the mitochondrial permeability transition pore: potential implications for hematopoietic stem cell function.Curr Opin Hematol. 2011 Jul;18(4):208-13. doi: 10.1097/MOH.0b013e3283475ffe. Curr Opin Hematol. 2011. PMID: 21537169 Review.
Cited by
-
Closing the Mitochondrial Permeability Transition Pore in hiPSC-Derived Endothelial Cells Induces Glycocalyx Formation and Functional Maturation.Stem Cell Reports. 2019 Nov 12;13(5):803-816. doi: 10.1016/j.stemcr.2019.10.005. Epub 2019 Oct 31. Stem Cell Reports. 2019. PMID: 31680061 Free PMC article.
-
One-Week High-Intensity Interval Training Increases Hippocampal Plasticity and Mitochondrial Content without Changes in Redox State.Antioxidants (Basel). 2020 May 21;9(5):445. doi: 10.3390/antiox9050445. Antioxidants (Basel). 2020. PMID: 32455608 Free PMC article.
-
Modeling cell response to low doses of photon irradiation: Part 2--application to radiation-induced chromosomal aberrations in human carcinoma cells.Radiat Environ Biophys. 2016 Mar;55(1):31-40. doi: 10.1007/s00411-015-0622-5. Epub 2015 Dec 26. Radiat Environ Biophys. 2016. PMID: 26708100
-
Ketogenic Diet and Ketone Bodies against Ischemic Injury: Targets, Mechanisms, and Therapeutic Potential.Int J Mol Sci. 2023 Jan 30;24(3):2576. doi: 10.3390/ijms24032576. Int J Mol Sci. 2023. PMID: 36768899 Free PMC article. Review.
-
Mitochondrial flashes: From indicator characterization to in vivo imaging.Methods. 2016 Oct 15;109:12-20. doi: 10.1016/j.ymeth.2016.06.004. Epub 2016 Jun 8. Methods. 2016. PMID: 27288722 Free PMC article.
References
Publication types
MeSH terms
Substances
Grants and funding
LinkOut - more resources
Full Text Sources
Other Literature Sources
Miscellaneous
