

Meta-analysis identifies NF-κB as a therapeutic target in renal cancer
- PMID: 24116146
- PMCID: PMC3792024
- DOI: 10.1371/journal.pone.0076746
Meta-analysis identifies NF-κB as a therapeutic target in renal cancer
Abstract
Objective: To determine the expression patterns of NF-κB regulators and target genes in clear cell renal cell carcinoma (ccRCC), their correlation with von Hippel Lindau (VHL) mutational status, and their association with survival outcomes.
Methods: Meta-analyses were carried out on published ccRCC gene expression datasets by RankProd, a non-parametric statistical method. DEGs with a False Discovery Rate of < 0.05 by this method were considered significant, and intersected with a curated list of NF-κB regulators and targets to determine the nature and extent of NF-κB deregulation in ccRCC.
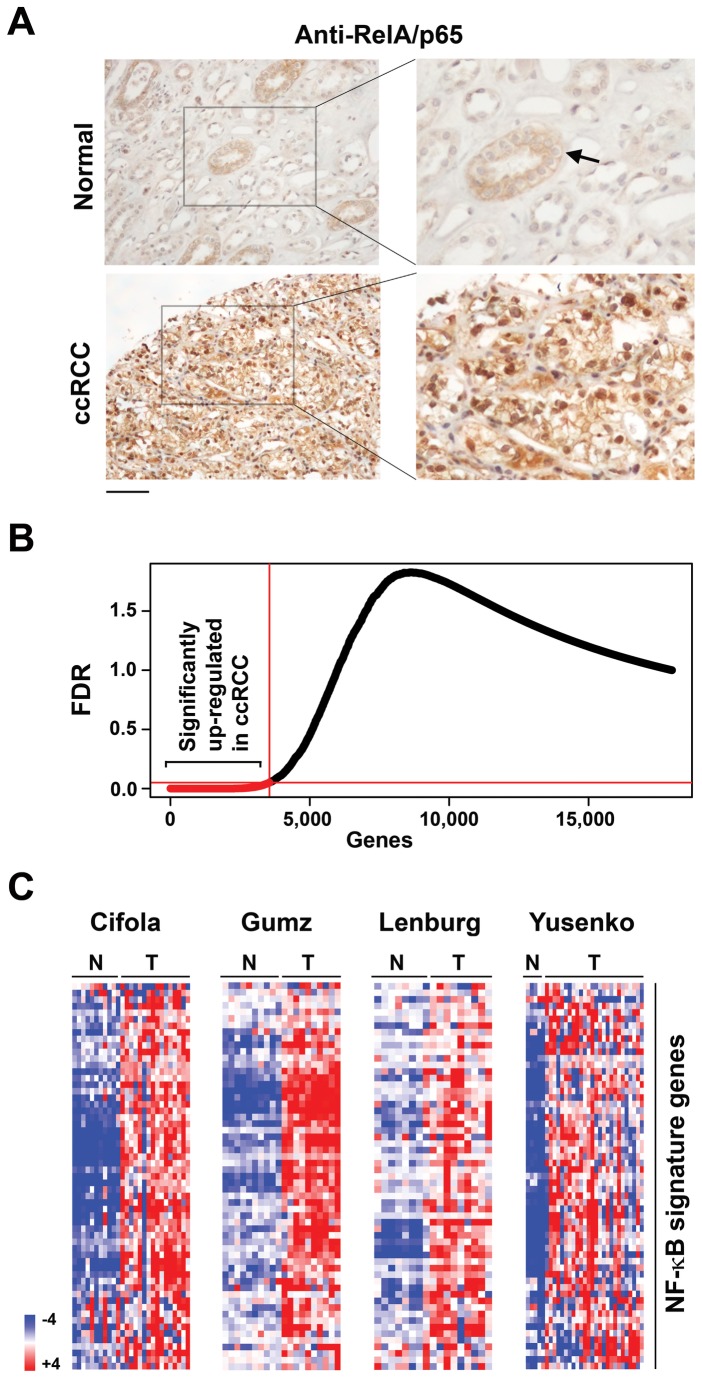
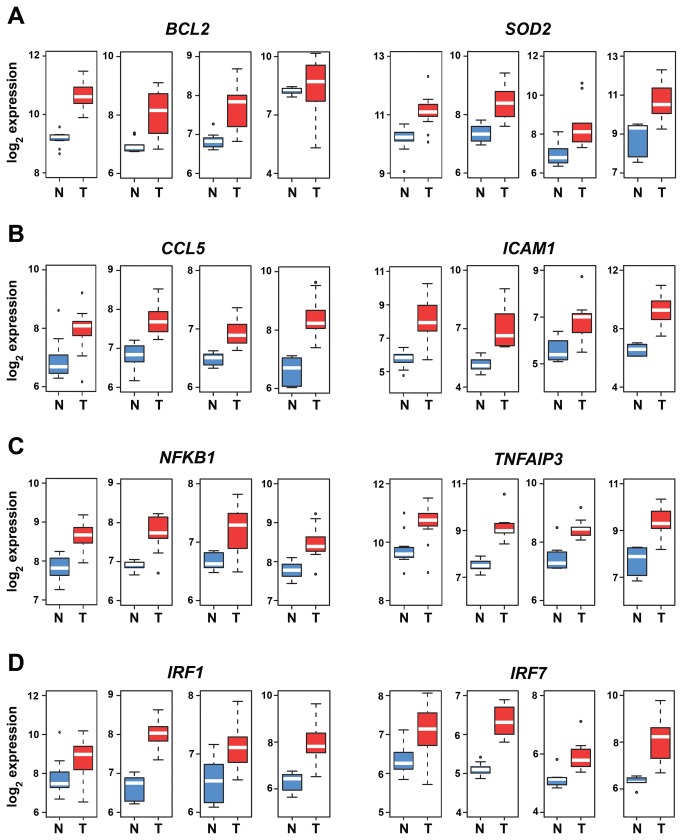
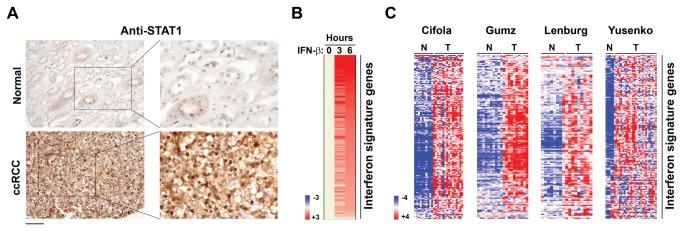
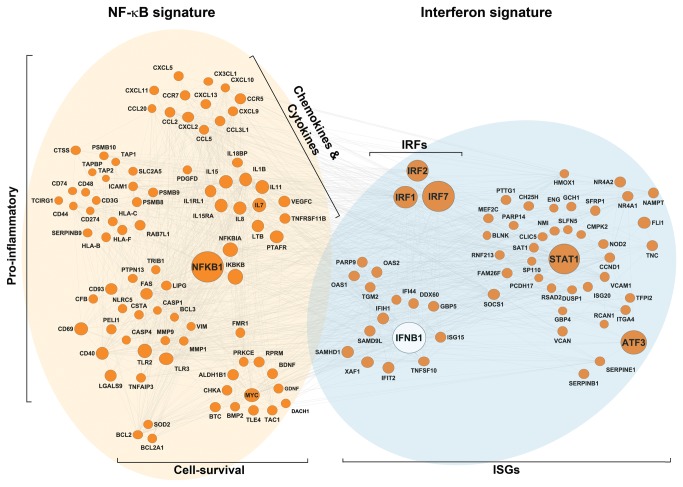
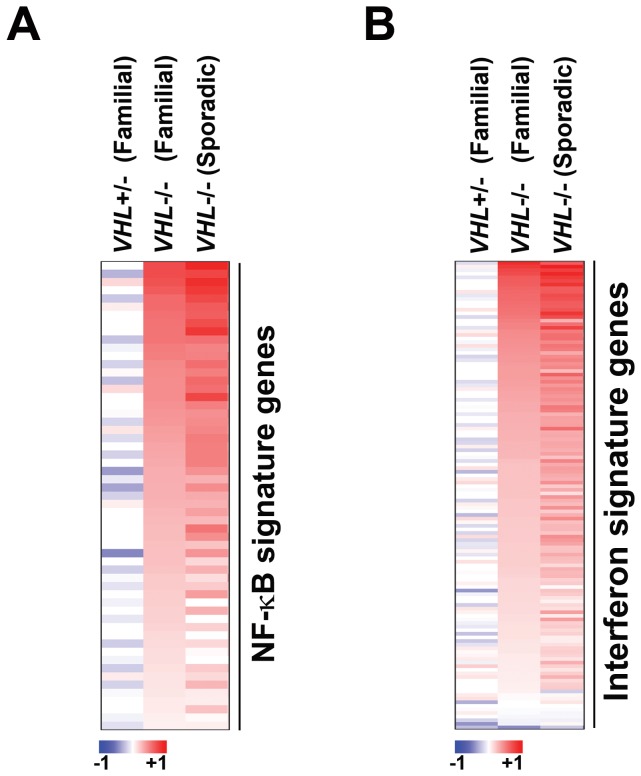
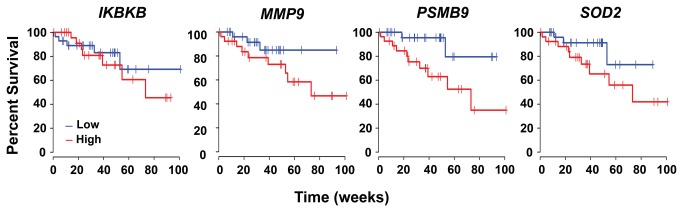
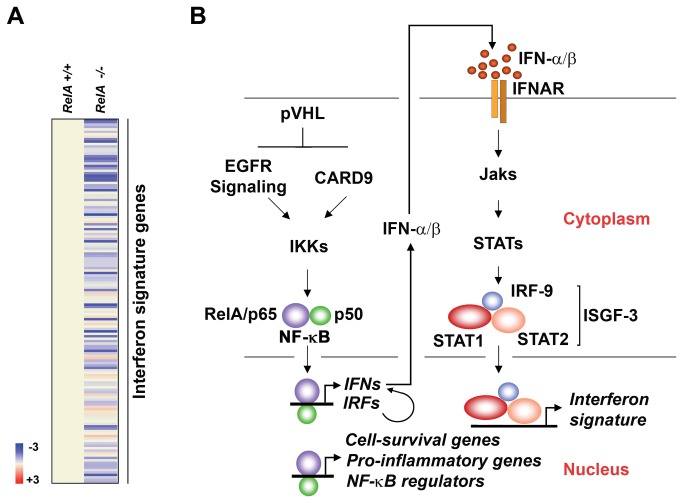
Results: A highly-disproportionate fraction (~40%; p < 0.001) of NF-κB regulators and target genes were found to be up-regulated in ccRCC, indicative of elevated NF-κB activity in this cancer. A subset of these genes, comprising a key NF-κB regulator (IKBKB) and established mediators of the NF-κB cell-survival and pro-inflammatory responses (MMP9, PSMB9, and SOD2), correlated with higher relative risk, poorer prognosis, and reduced overall patient survival. Surprisingly, levels of several interferon regulatory factors (IRFs) and interferon target genes were also elevated in ccRCC, indicating that an 'interferon signature' may represent a novel feature of this disease. Loss of VHL gene expression correlated strongly with the appearance of NF-κB- and interferon gene signatures in both familial and sporadic cases of ccRCC. As NF-κB controls expression of key interferon signaling nodes, our results suggest a causal link between VHL loss, elevated NF-κB activity, and the appearance of an interferon signature during ccRCC tumorigenesis.
Conclusions: These findings identify NF-κB and interferon signatures as clinical features of ccRCC, provide strong rationale for the incorporation of NF-κB inhibitors and/or and the exploitation of interferon signaling in the treatment of ccRCC, and supply new NF-κB targets for potential therapeutic intervention in this currently-incurable malignancy.
Conflict of interest statement
Figures
Similar articles
-
Human renal carcinoma cells respond to Newcastle disease virus infection through activation of the p38 MAPK/NF-κB/IκBα pathway.Cell Oncol (Dordr). 2015 Aug;38(4):279-88. doi: 10.1007/s13402-015-0229-5. Epub 2015 May 1. Cell Oncol (Dordr). 2015. PMID: 25930675
-
The Hippo pathway effector YAP inhibits NF-κB signaling and ccRCC growth by opposing ZHX2.J Biol Chem. 2025 May;301(5):108430. doi: 10.1016/j.jbc.2025.108430. Epub 2025 Mar 20. J Biol Chem. 2025. PMID: 40120683 Free PMC article.
-
High VHL Expression Reverses Warburg Phenotype and Enhances Immunogenicity in Kidney Tumor Cells.Genomics Proteomics Bioinformatics. 2022 Aug;20(4):657-669. doi: 10.1016/j.gpb.2019.12.002. Epub 2021 Feb 27. Genomics Proteomics Bioinformatics. 2022. PMID: 33647481 Free PMC article.
-
The emerging role of nuclear factor kappa B in renal cell carcinoma.Int J Biochem Cell Biol. 2011 Nov;43(11):1537-49. doi: 10.1016/j.biocel.2011.08.003. Epub 2011 Aug 12. Int J Biochem Cell Biol. 2011. PMID: 21854869 Review.
-
Hypoxia, Hypoxia-inducible Transcription Factors, and Renal Cancer.Eur Urol. 2016 Apr;69(4):646-657. doi: 10.1016/j.eururo.2015.08.007. Epub 2015 Aug 19. Eur Urol. 2016. PMID: 26298207 Free PMC article. Review.
Cited by
-
Silencing of nuclear factor kappa b 1 gene expression inhibits colony formation, cell migration and invasion via the downregulation of interleukin 1 beta and matrix metallopeptidase 9 in renal cell carcinoma.Mol Biol Rep. 2020 Feb;47(2):1143-1151. doi: 10.1007/s11033-019-05212-9. Epub 2019 Dec 10. Mol Biol Rep. 2020. PMID: 31820316
-
Personalized Driver Gene Prediction Using Graph Convolutional Networks with Conditional Random Fields.Biology (Basel). 2024 Mar 14;13(3):184. doi: 10.3390/biology13030184. Biology (Basel). 2024. PMID: 38534453 Free PMC article.
-
APOBEC3C-mediated NF-κB activation enhances clear cell renal cell carcinoma progression.Mol Oncol. 2025 Jan;19(1):114-132. doi: 10.1002/1878-0261.13721. Epub 2024 Aug 26. Mol Oncol. 2025. PMID: 39183666 Free PMC article.
-
Differential behavior of NF-κB, IκBα and EGFR during the renal carcinogenic process in an experimental model in vivo.Oncol Lett. 2020 Apr;19(4):3153-3164. doi: 10.3892/ol.2020.11436. Epub 2020 Mar 3. Oncol Lett. 2020. PMID: 32256811 Free PMC article.
-
NF-κB, the Importance of Being Dynamic: Role and Insights in Cancer.Biomedicines. 2018 Apr 17;6(2):45. doi: 10.3390/biomedicines6020045. Biomedicines. 2018. PMID: 29673148 Free PMC article. Review.
References
-
- Störkel S, Eble JN, Adlakha K, Amin M, Blute ML et al. (1997) Classification of renal cell carcinoma: Workgroup No. 1. Union Internationale Contre le Cancer (UICC) and the American Joint Committee on Cancer (AJCC). Cancer 80: 987-989. doi:10.1002/(SICI)1097-0142(19970901)80:5. PubMed: 9307203. - DOI - PubMed
Publication types
MeSH terms
Substances
Grants and funding
LinkOut - more resources
Full Text Sources
Other Literature Sources
Medical
Research Materials
Miscellaneous
