. 2013 Oct 8;8(10):e76830.
doi: 10.1371/journal.pone.0076830. eCollection 2013.

The expression of CD90/Thy-1 in hepatocellular carcinoma: an in vivo and in vitro study

Affiliations

The expression of CD90/Thy-1 in hepatocellular carcinoma: an in vivo and in vitro study

Caecilia Hapsari Ceriapuri Sukowati et al. PLoS One. .

Abstract

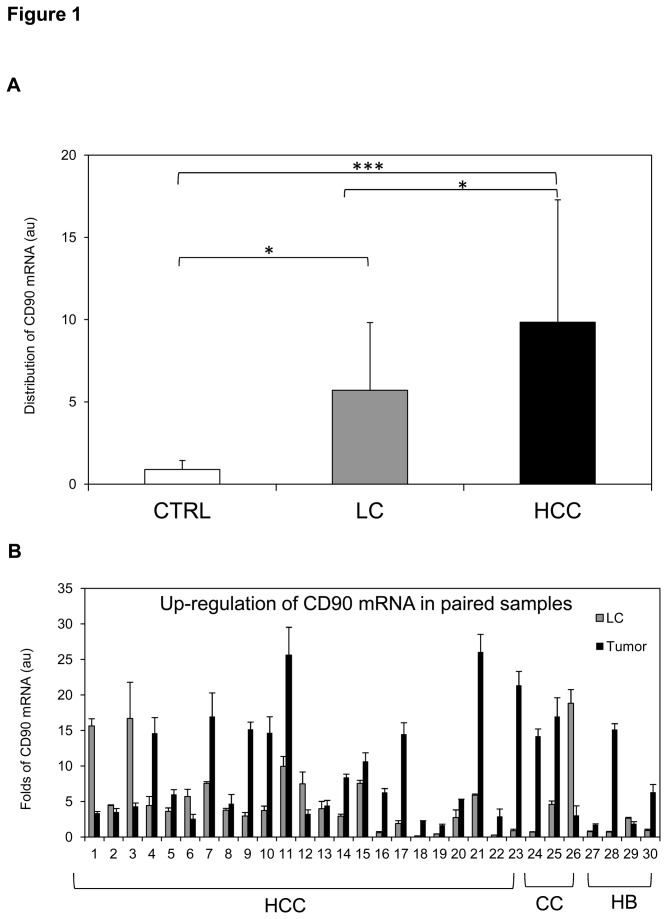
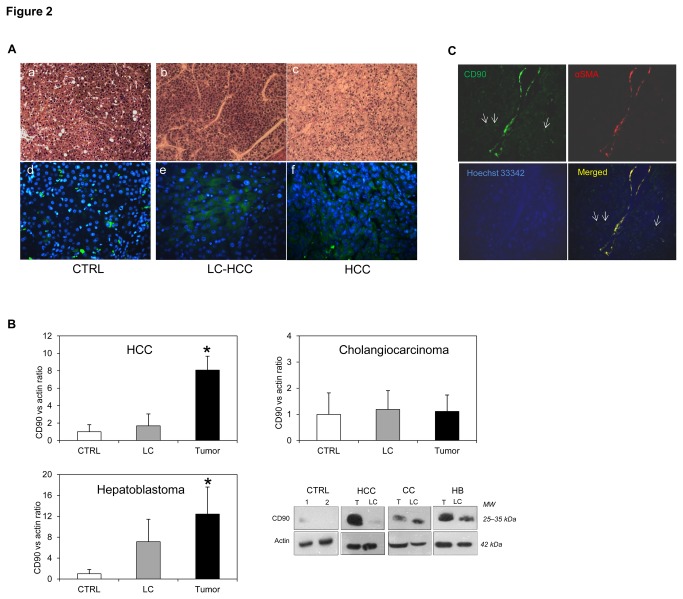
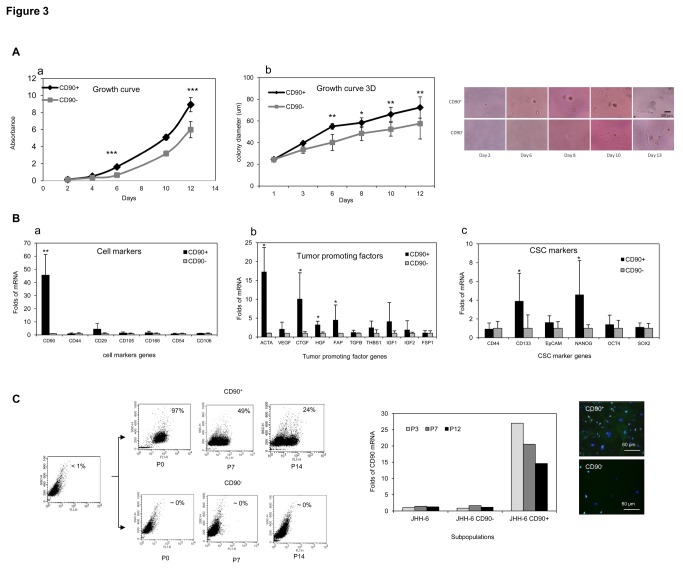
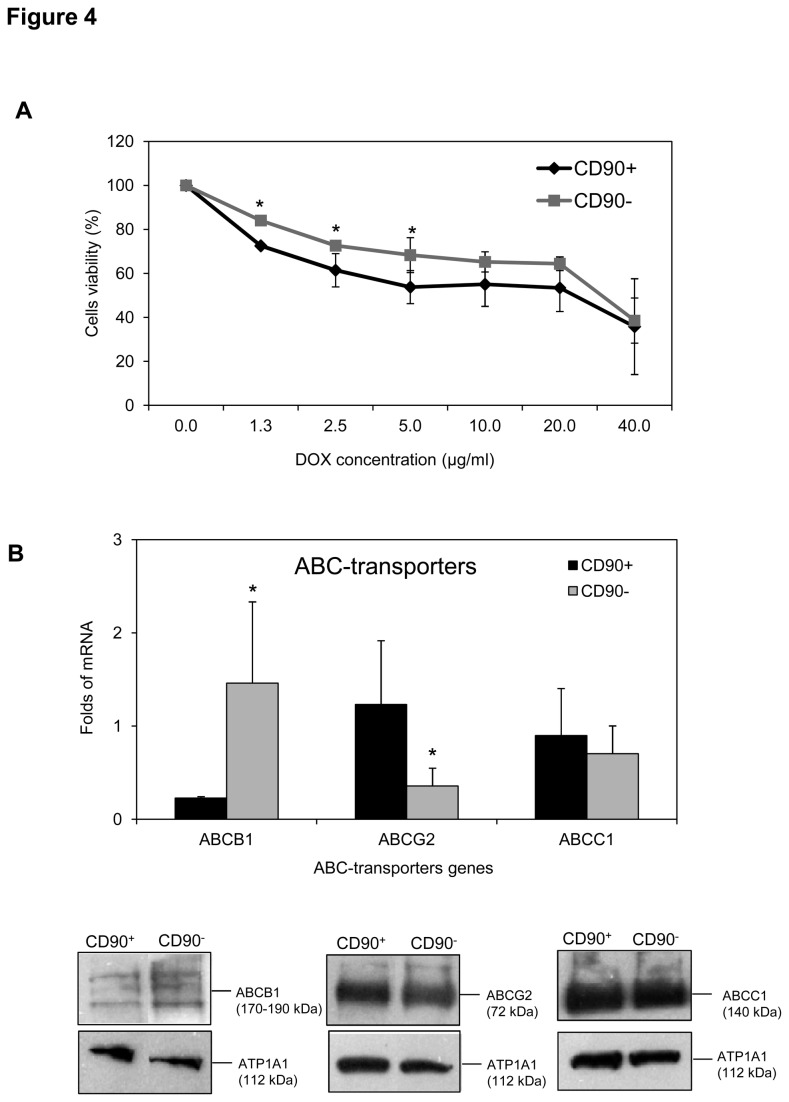
Although the CD90 (Thy-1) was proposed as biomarker of several tumors and cancer stem cells, the involvement of this molecule in the progression of hepatocellular carcinoma (HCC) and other less frequent hepatic neoplasms is still undefined. The distribution of CD90 was investigated both in in vivo (human tissues samples) and in vitro (human HCC cell line JHH-6). A total of 67 liver tumors were analyzed: 51 HCC, 6 cholangiocarcinoma and 10 hepatoblastoma. In all cases, paired tissue sample of both the tumor and cirrhotic liver was available. Hepatic tissue obtained in 12 healthy livers was used as control. CD90 gene expression was studied by RT-qPCR, protein expression was assessed by quantitative Western Blot, immunofluorescence and flow cytometry. The CD90 expression analysis showed a significant increment in tumor compared to both its paired cirrhotic tissue and normal liver (p<0.05 and p<0.001, respectively). This increase was accompanied by the up-regulation of stromal component in the cancer, as demonstrated by alpha smooth muscle actin staining. In vitro analysis of JHH-6 cell line showed a higher proliferation capacity of CD90(+) compared to CD90(-) cells (p<0.001), also noticed in 3D clonogenic assay (p<0.05), associated by a significant higher expression of the promoting factors (hepatocyte growth factor, fibroblast associated protein and alpha smooth muscle actin 2). A higher expression of the breast cancer resistance protein was found in CD90(+) subpopulation while the multidrug resistance protein 1 showed an opposite behavior. Collectively, these results point to the importance of CD90 in the HCC.


Conflict of interest statement

Competing Interests: The authors declare they have no competing interests as defined by PLoS ONE or other interests that might be perceived to influence the results and discussion reported in this paper.

Figures

Figure 1
Figure 1. The mRNA expression of CD90/Thy-1 in primary liver cancer by RT-qPCR analysis.
A. CD90 distribution in normal liver CTRL (n=12), liver cirrhosis LC of HCC (n=26) and HCC (n=25). Statistical analysis was performed using one-way ANOVA with Bonferroni post-test (*p<0.05, ***p<0.001). Data represented mean ± SD. B. CD90 gene up-regulation in paired individuals of HCC (1-23), cholangiocarcinoma (CC, 24-26), and hepatoblastoma (HB, 27-30). CD90 mRNA relative expression was normalized to reference genes 18SRNA and β-actin; the expression of a normal sample was considered as 1.00 au.
Figure 2
Figure 2. The protein analysis of CD90/Thy-1 in primary liver cancers.
A. Histological hematoxylin-eosin analysis and CD90 protein distribution in microdissected tissues of normal CTRL (a,d), liver cirrhotic LC of HCC (b,e) and tumoral tissue HCC (c,f). Magnification: objective 20X (a-c), 40x (d-f); CD90-FITC: green, Hoechst 33342: blue. B. Western Blot analysis represented mean ± SD values of CD90 protein expression in LC and tumoral tissues of HCC (n=14), cholangiocarcinoma (CC, n=6), and hepatoblastoma (HB, n=10) compared to normal CTRL (n=6). Protein quantification was performed using densitometric analysis of bands CD90 vs. actin in each sample. Statistical analysis was performed using one-way Anova with Bonferroni post-test (*p<0.05 compared to CTRL). Lower right panel: representative blot of each paired tissues compared to CTRL. C. The co-expression of CD90 with αSMA in tumoral tissue of HCC. CD90 protein (green), αSMA (red), and nucleus (Hoechst 33342, blue). Arrows indicated CD90+SMA- cells. Magnification: objective 20X.
Figure 3
Figure 3. The growth capacity of the JHH-6 subpopulations CD90+ and CD90-.
A. Growth curve after 12 days subculture of attached cells (a) and 3D colony in matrigel (b). B. mRNA analysis of cells markers (a), tumor promoting factors (b), and CSC markers genes (c). mRNA relative expression was normalized to reference genes 18SRNA and β-actin; the expression of CD90- cells was considered as 1.00 (Students’ t test *p<0.05, ***p<0.001 compared to CD90-). C. The alteration of CD90+ cells phenotypes during subculture. Upper panel: FACS analysis of fresh-purified JHH-6 subpopulations CD90+ and CD90- during subculture (passage 1-15). The number in each plots represented CD90+ positivity. Lower left panel: CD90 mRNA analysis of subpopulations CD90+ and CD90- together with unsorted JHH-6 cells during subculture. Lower right panel: IF analysis of subpopulations CD90+ and CD90-. Magnification: objective 40X.
Figure 4
Figure 4. The potency of DOX resistance of the JHH-6 subpopulations CD90+ and CD90-.
A. Cells viability against DOX (0-40 µg/ml) for 24 hours assessed by MTT assay. Non-treated cells were considered as 100% viability (Students’ t test *p<0.05). The data represented the mean ± SD of three independent experiments. B. The mRNA and protein expression of DOX-related ABC transporters ABCB1, ABCCC1, and ABCG2 genes (Students’ t test *p<0.05 compared to CD90-). Low panel: WB analysis of each proteins ABCG2 (72 kDa), ABCB1 (170-190 kDa), and ABCC1 (140 kDa) together with ATP1A1 membrane protein (112 KDa).

Similar articles

Cited by

References

    1. Parkin DM, Bray F, Ferlay J, Pisani P (2001) Estimating the world cancer burden: Globocan 2000. Int J Cancer 94: 153-156. doi:10.1002/ijc.1440. PubMed: 11668491. - DOI - PubMed
    1. Llovet JM, Burroughs A, Bruix J (2003) Hepatocellular carcinoma. Lancet 362: 1907-1917. doi:10.1016/S0140-6736(03)14964-1. PubMed: 14667750. - DOI - PubMed
    1. El-Serag HB, Rudolph KL (2007) Hepatocellular carcinoma: epidemiology and molecular carcinogenesis. Gastroenterology 132: 2557-2576. doi:10.1053/j.gastro.2007.04.061. PubMed: 17570226. - DOI - PubMed
    1. Simonetti RG, Cammà C, Fiorello F, Politi F, D’Amico G et al. (1991) Hepatocellular carcinoma. A worldwide problem and the major risk factors. Dig Dis Sci 36: 962-972. doi:10.1007/BF01297149. PubMed: 1649041. - DOI - PubMed
    1. European Association for The Study of The Liver, European Organisation For Research And Treatment Of Cancer (2012) EASL-EORTC clinical practice guidelines: management of hepatocellular carcinoma. J Hepatol 56: 908-943. PubMed: 22424438. - PubMed

Publication types

MeSH terms

Substances