Transcriptome-mining for single-copy nuclear markers in ferns
- PMID: 24116189
- PMCID: PMC3792871
- DOI: 10.1371/journal.pone.0076957
Transcriptome-mining for single-copy nuclear markers in ferns
Abstract
Background: Molecular phylogenetic investigations have revolutionized our understanding of the evolutionary history of ferns-the second-most species-rich major group of vascular plants, and the sister clade to seed plants. The general absence of genomic resources available for this important group of plants, however, has resulted in the strong dependence of these studies on plastid data; nuclear or mitochondrial data have been rarely used. In this study, we utilize transcriptome data to design primers for nuclear markers for use in studies of fern evolutionary biology, and demonstrate the utility of these markers across the largest order of ferns, the Polypodiales.
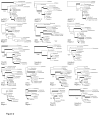
Principal findings: We present 20 novel single-copy nuclear regions, across 10 distinct protein-coding genes: ApPEFP_C, cryptochrome 2, cryptochrome 4, DET1, gapCpSh, IBR3, pgiC, SQD1, TPLATE, and transducin. These loci, individually and in combination, show strong resolving power across the Polypodiales phylogeny, and are readily amplified and sequenced from our genomic DNA test set (from 15 diploid Polypodiales species). For each region, we also present transcriptome alignments of the focal locus and related paralogs-curated broadly across ferns-that will allow researchers to develop their own primer sets for fern taxa outside of the Polypodiales. Analyses of sequence data generated from our genomic DNA test set reveal strong effects of partitioning schemes on support levels and, to a much lesser extent, on topology. A model partitioned by codon position is strongly favored, and analyses of the combined data yield a Polypodiales phylogeny that is well-supported and consistent with earlier studies of this group.
Conclusions: The 20 single-copy regions presented here more than triple the single-copy nuclear regions available for use in ferns. They provide a much-needed opportunity to assess plastid-derived hypotheses of relationships within the ferns, and increase our capacity to explore aspects of fern evolution previously unavailable to scientific investigation.
Conflict of interest statement
Figures


References
-
- Hasebe M, Wolf PG, Pryer KM, Ueda K, Ito M et al. (1995) Fern phylogeny based on rbcL nucleotide sequences. Am Fern J 85: 134–181. doi:10.2307/1547807. - DOI
-
- Pryer KM, Smith AR, Skog JE (1995) Phylogenetic relationships of extant ferns based on evidence from morphology and rbcL sequences. Am Fern J 85: 205–282. doi:10.2307/1547810. - DOI
Publication types
MeSH terms
Substances
Associated data
- Actions
- Actions
- Actions
- Actions
- Actions
- Actions
- Actions
- Actions
- Actions
- Actions
- Actions
- Actions
- Actions
- Actions
- Actions
- Actions
- Actions
- Actions
- Actions
- Actions
- Actions
- Actions
- Actions
- Actions
- Actions
- Actions
- Actions
- Actions
- Actions
- Actions
- Actions
- Actions
- Actions
- Actions
- Actions
- Actions
- Actions
- Actions
- Actions
- Actions
- Actions
- Actions
- Actions
- Actions
- Actions
- Actions
- Actions
- Actions
- Actions
- Actions
- Actions
- Actions
- Actions
- Actions
- Actions
- Actions
- Actions
- Actions
- Actions
- Actions
- Actions
- Actions
- Actions
- Actions
- Actions
- Actions
- Actions
- Actions
- Actions
- Actions
- Actions
- Actions
- Actions
- Actions
- Actions
- Actions
- Actions
- Actions
- Actions
- Actions
- Actions
- Actions
- Actions
- Actions
- Actions
- Actions
- Actions
- Actions
- Actions
- Actions
- Actions
- Actions
- Actions
- Actions
- Actions
- Actions
- Actions
- Actions
- Actions
- Actions
- Actions
- Actions
- Actions
- Actions
- Actions
- Actions
- Actions
- Actions
- Actions
- Actions
- Actions
- Actions
- Actions
- Actions
- Actions
- Actions
- Actions
- Actions
- Actions
- Actions
- Actions
- Actions
- Actions
- Actions
- Actions
- Actions
- Actions
- Actions
- Actions
- Actions
- Actions
- Actions
- Actions
- Actions
- Actions
- Actions
- Actions
- Actions
- Actions
- Actions
- Actions
- Actions
- Actions
- Actions
- Actions
- Actions
- Actions
- Actions
- Actions
- Actions
- Actions
- Actions
- Actions
- Actions
- Actions
- Actions
- Actions
- Actions
- Actions
- Actions
- Actions
- Actions
- Actions
- Actions
- Actions
- Actions
- Actions
- Actions
- Actions
- Actions
- Actions
- Actions
- Actions
- Actions
- Actions
- Actions
- Actions
- Actions
- Actions
- Actions
- Actions
- Actions
- Actions
- Actions
- Actions
- Actions
- Actions
- Actions
- Actions
- Actions
- Actions
- Actions
- Actions
- Actions
- Actions
- Actions
- Actions
- Actions
- Actions
- Actions
- Actions
- Actions
- Actions
- Actions
- Actions
- Actions
- Actions
- Actions
- Actions
- Actions
- Actions
- Actions
- Actions
- Actions
- Actions
- Actions
- Actions
- Actions
- Actions
- Actions
- Actions
- Actions
- Actions
- Actions
- Actions
- Actions
- Actions
- Actions
- Actions
LinkOut - more resources
Full Text Sources
Other Literature Sources

