

Diet-sensitive sources of reactive oxygen species in liver mitochondria: role of very long chain acyl-CoA dehydrogenases
- PMID: 24116206
- PMCID: PMC3792056
- DOI: 10.1371/journal.pone.0077088
Diet-sensitive sources of reactive oxygen species in liver mitochondria: role of very long chain acyl-CoA dehydrogenases
Abstract
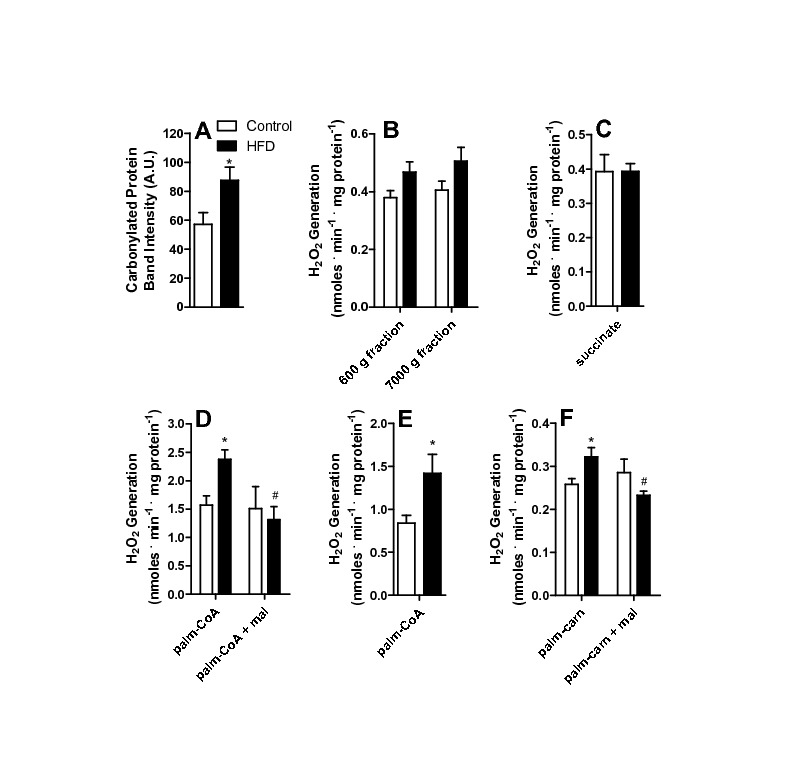
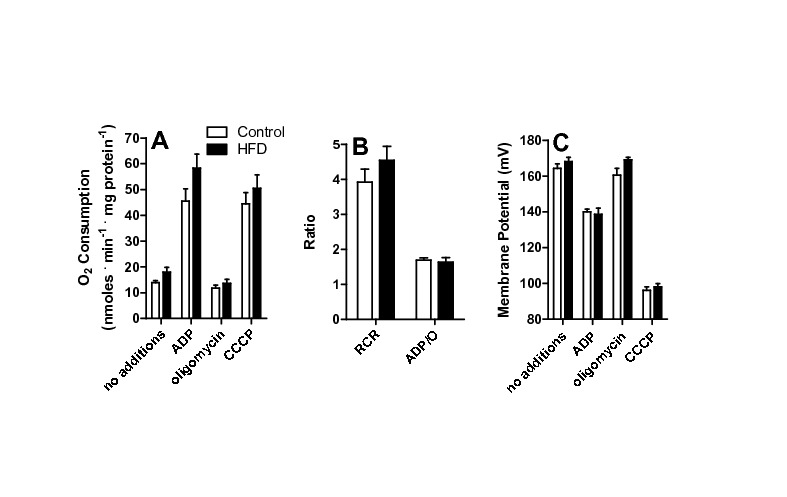
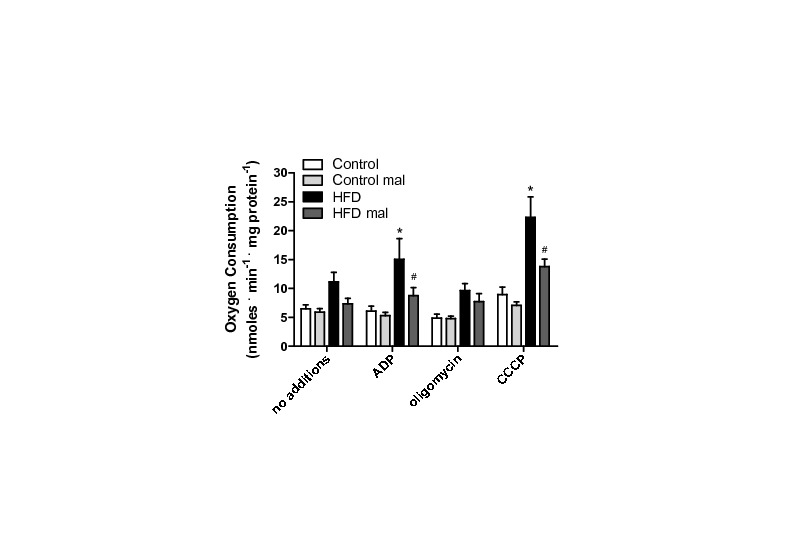
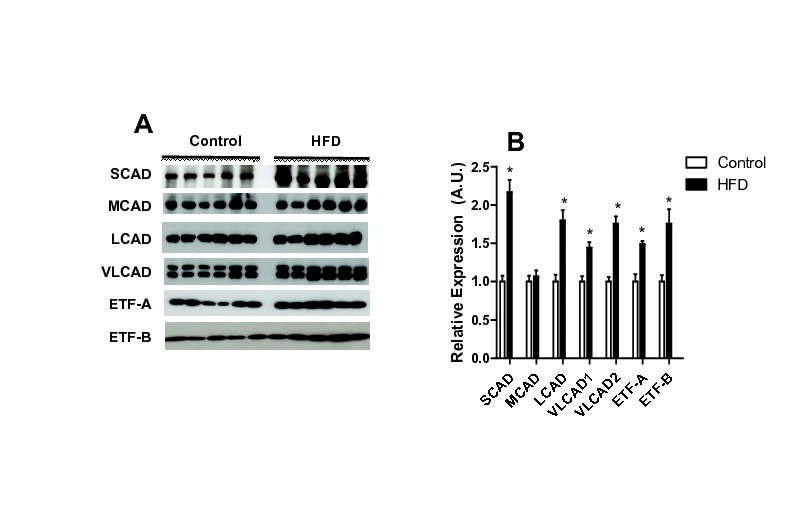
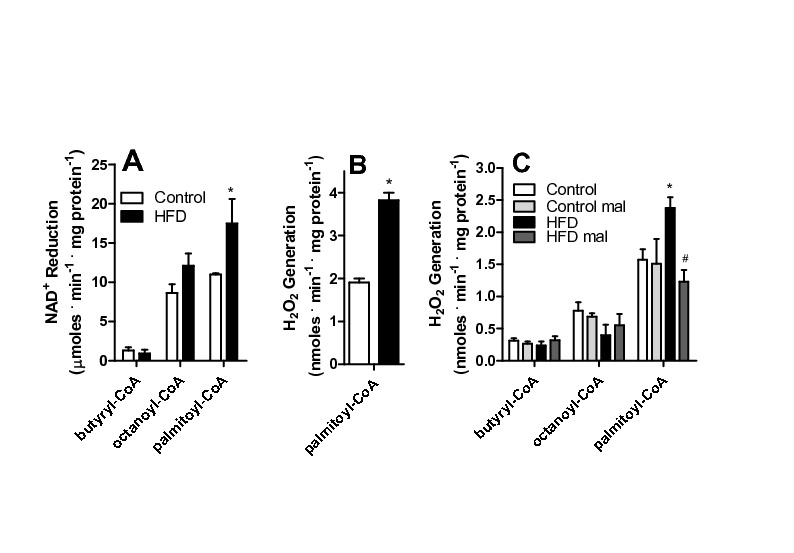
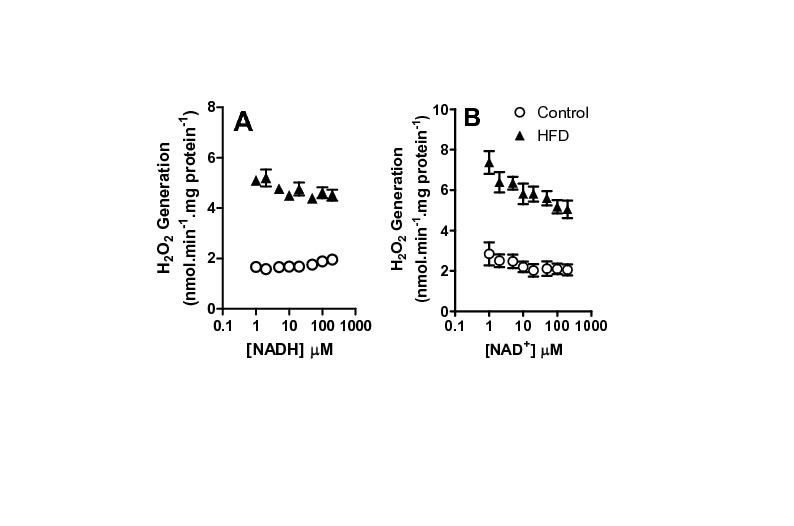
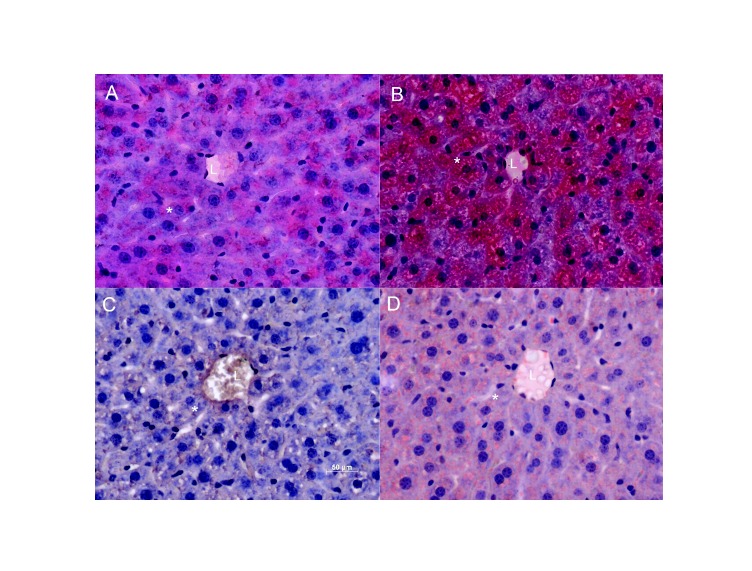
High fat diets and accompanying hepatic steatosis are highly prevalent conditions. Previous work has shown that steatosis is accompanied by enhanced generation of reactive oxygen species (ROS), which may mediate further liver damage. Here we investigated mechanisms leading to enhanced ROS generation following high fat diets (HFD). We found that mitochondria from HFD livers present no differences in maximal respiratory rates and coupling, but generate more ROS specifically when fatty acids are used as substrates. Indeed, many acyl-CoA dehydrogenase isoforms were found to be more highly expressed in HFD livers, although only the very long chain acyl-CoA dehydrogenase (VLCAD) was more functionally active. Studies conducted with permeabilized mitochondria and different chain length acyl-CoA derivatives suggest that VLCAD is also a source of ROS production in mitochondria of HFD animals. This production is stimulated by the lack of NAD(+). Overall, our studies uncover VLCAD as a novel, diet-sensitive, source of mitochondrial ROS.
Conflict of interest statement
Figures
Similar articles
-
H2O2 release from the very long chain acyl-CoA dehydrogenase.Redox Biol. 2015;4:375-80. doi: 10.1016/j.redox.2015.02.003. Epub 2015 Feb 20. Redox Biol. 2015. PMID: 25728796 Free PMC article.
-
Tissue-specific strategies of the very-long chain acyl-CoA dehydrogenase-deficient (VLCAD-/-) mouse to compensate a defective fatty acid β-oxidation.PLoS One. 2012;7(9):e45429. doi: 10.1371/journal.pone.0045429. Epub 2012 Sep 14. PLoS One. 2012. PMID: 23024820 Free PMC article.
-
Gestational, pathologic and biochemical differences between very long-chain acyl-CoA dehydrogenase deficiency and long-chain acyl-CoA dehydrogenase deficiency in the mouse.Hum Mol Genet. 2001 Sep 15;10(19):2069-77. doi: 10.1093/hmg/10.19.2069. Hum Mol Genet. 2001. PMID: 11590124
-
Very long-chain acyl-CoA dehydrogenase (VLCAD-) deficiency-studies on treatment effects and long-term outcomes in mouse models.J Inherit Metab Dis. 2017 May;40(3):317-323. doi: 10.1007/s10545-017-0016-8. Epub 2017 Feb 28. J Inherit Metab Dis. 2017. PMID: 28247148 Review.
-
Genetic and cellular modifiers of oxidative stress: what can we learn from fatty acid oxidation defects?Mol Genet Metab. 2013;110 Suppl:S31-9. doi: 10.1016/j.ymgme.2013.10.007. Epub 2013 Oct 12. Mol Genet Metab. 2013. PMID: 24206932 Review.
Cited by
-
The Crosstalk between Microbiome and Mitochondrial Homeostasis in Neurodegeneration.Cells. 2023 Jan 28;12(3):429. doi: 10.3390/cells12030429. Cells. 2023. PMID: 36766772 Free PMC article. Review.
-
H2O2 release from the very long chain acyl-CoA dehydrogenase.Redox Biol. 2015;4:375-80. doi: 10.1016/j.redox.2015.02.003. Epub 2015 Feb 20. Redox Biol. 2015. PMID: 25728796 Free PMC article.
-
Optical Metabolic Imaging of Mitochondrial Dysfunction on HADH Mutant Newborn Rat Hearts.IEEE J Transl Eng Health Med. 2021 Aug 16;9:1800407. doi: 10.1109/JTEHM.2021.3104966. eCollection 2021. IEEE J Transl Eng Health Med. 2021. PMID: 34462673 Free PMC article.
-
Effects of high fat diets on rodent liver bioenergetics and oxidative imbalance.Redox Biol. 2016 Aug;8:216-25. doi: 10.1016/j.redox.2016.01.009. Epub 2016 Jan 14. Redox Biol. 2016. PMID: 26826574 Free PMC article. Review.
-
Integrative Utilization of Transcriptomics and Metabolomics Sheds Light on Disparate Growth Performance of Whiteleg Shrimp, Litopenaeus vannamei.Int J Mol Sci. 2025 Mar 28;26(7):3133. doi: 10.3390/ijms26073133. Int J Mol Sci. 2025. PMID: 40243931 Free PMC article.
References
Publication types
MeSH terms
Substances
LinkOut - more resources
Full Text Sources
Other Literature Sources
Miscellaneous
