

Single-Molecule Analysis of Cytochrome c Folding by Monitoring the Lifetime of an Attached Fluorescent Probe
- PMID: 24116268
- PMCID: PMC3791595
- DOI: 10.1021/jz401259y
Single-Molecule Analysis of Cytochrome c Folding by Monitoring the Lifetime of an Attached Fluorescent Probe
Abstract
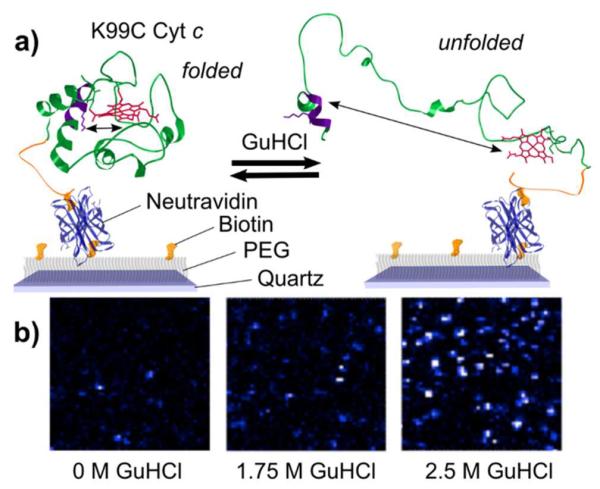
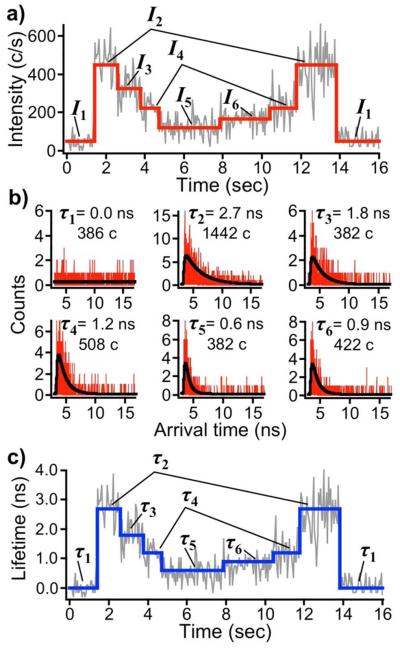
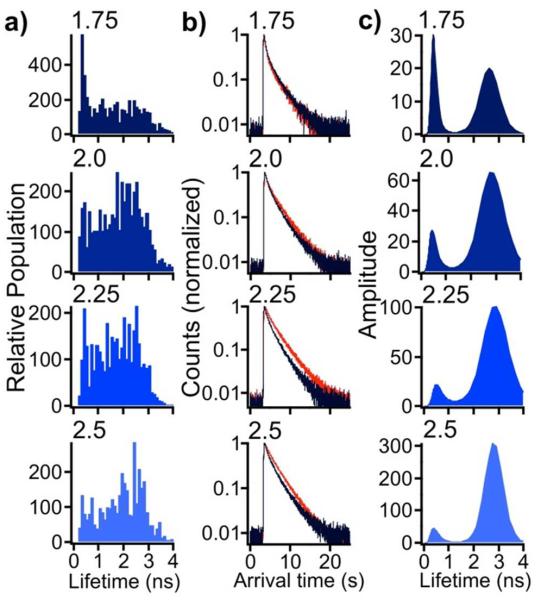
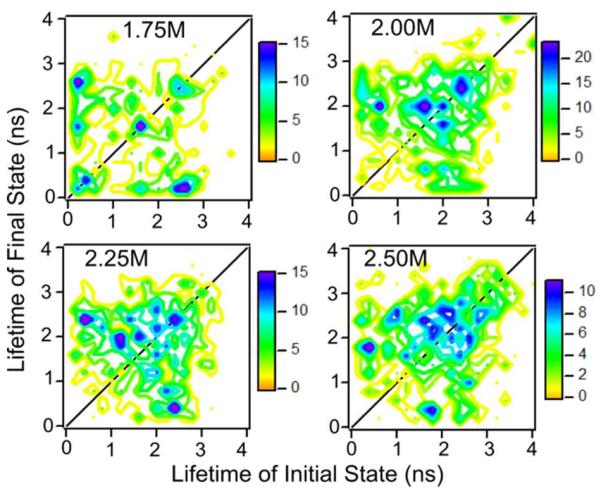
Conformational dynamics of proteins are important for function. However, obtaining information about specific conformations is difficult for samples displaying heterogeneity. Here, time-resolved fluorescence resonance energy transfer is used to characterize the folding of single cytochrome c molecules. In particular, measurements of the fluorescence lifetimes of individual cytochrome c molecules labeled with a single dye that is quenched by energy transfer to the heme were used to monitor conformational transitions of the protein under partially denaturing conditions. These studies indicate significantly more conformational heterogeneity than has been described previously. Importantly, the use of a purified singly-labeled sample made a direct comparison to ensemble data possible. The distribution of lifetimes of single-proteins was compared to the distribution of lifetimes determined from analysis of ensemble lifetime fluorescence data. The results show broad agreement between single-molecule and ensemble data, with a similar range of lifetimes. However, the single-molecule data reveal greater conformational heterogeneity.
Keywords: change-point algorithm; confocal microscopy; protein folding; single-molecule fluorescence lifetime.
Figures
Similar articles
-
Single-molecule Forster resonance energy transfer study of protein dynamics under denaturing conditions.Proc Natl Acad Sci U S A. 2005 Oct 25;102(43):15471-6. doi: 10.1073/pnas.0507728102. Epub 2005 Oct 12. Proc Natl Acad Sci U S A. 2005. PMID: 16221762 Free PMC article.
-
Microsecond protein dynamics observed at the single-molecule level.Nat Commun. 2015 Jul 7;6:7685. doi: 10.1038/ncomms8685. Nat Commun. 2015. PMID: 26151767 Free PMC article.
-
Single-molecule fluorescence studies of protein folding.Methods Mol Biol. 2009;490:311-37. doi: 10.1007/978-1-59745-367-7_13. Methods Mol Biol. 2009. PMID: 19157089
-
Studies of protein folding and dynamics using single molecule fluorescence spectroscopy.Phys Chem Chem Phys. 2014 Jun 21;16(23):11139-49. doi: 10.1039/c3cp55219e. Epub 2014 May 8. Phys Chem Chem Phys. 2014. PMID: 24805942 Review.
-
Fluorescence resonance energy transfer (FRET) and competing processes in donor-acceptor substituted DNA strands: a comparative study of ensemble and single-molecule data.J Biotechnol. 2002 Jan;82(3):211-31. doi: 10.1016/s1389-0352(01)00039-3. J Biotechnol. 2002. PMID: 11999691 Review.
Cited by
-
Protein folding from heterogeneous unfolded state revealed by time-resolved X-ray solution scattering.Proc Natl Acad Sci U S A. 2020 Jun 30;117(26):14996-15005. doi: 10.1073/pnas.1913442117. Epub 2020 Jun 15. Proc Natl Acad Sci U S A. 2020. PMID: 32541047 Free PMC article.
References
-
- Frauenfelder H, Sligar SG, Wolynes PG. The Energy Landscapes and Motions of Proteins. Science. 1991;254:1598–1603. - PubMed
Grants and funding
LinkOut - more resources
Full Text Sources
Other Literature Sources
