

Molecular recognition of DNA by ligands: roughness and complexity of the free energy profile
- PMID: 24116648
- PMCID: PMC3808439
- DOI: 10.1063/1.4824106
Molecular recognition of DNA by ligands: roughness and complexity of the free energy profile
Erratum in
- J Chem Phys. 2013 Dec 14;139(22):229901. Vargiu, Attlio Vittorio [corrected to Vargiu, Attilio Vittorio]
Abstract
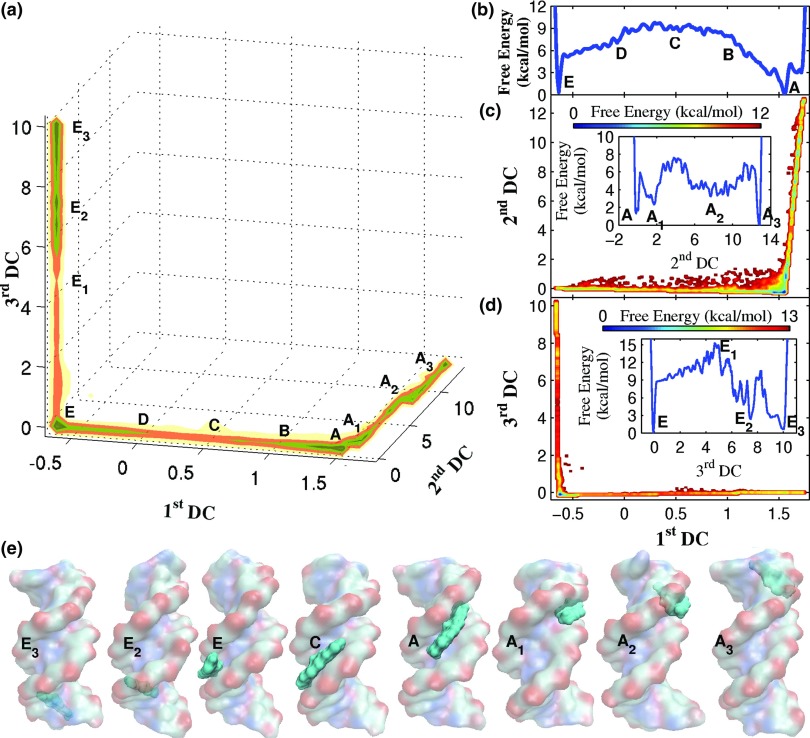
Understanding the molecular mechanism by which probes and chemotherapeutic agents bind to nucleic acids is a fundamental issue in modern drug design. From a computational perspective, valuable insights are gained by the estimation of free energy landscapes as a function of some collective variables (CVs), which are associated with the molecular recognition event. Unfortunately the choice of CVs is highly non-trivial because of DNA's high flexibility and the presence of multiple association-dissociation events at different locations and/or sliding within the grooves. Here we have applied a modified version of Locally-Scaled Diffusion Map (LSDMap), a nonlinear dimensionality reduction technique for decoupling multiple-timescale dynamics in macromolecular systems, to a metadynamics-based free energy landscape calculated using a set of intuitive CVs. We investigated the binding of the organic drug anthramycin to a DNA 14-mer duplex. By performing an extensive set of metadynamics simulations, we observed sliding of anthramycin along the full-length DNA minor groove, as well as several detachments from multiple sites, including the one identified by X-ray crystallography. As in the case of equilibrium processes, the LSDMap analysis is able to extract the most relevant collective motions, which are associated with the slow processes within the system, i.e., ligand diffusion along the minor groove and dissociation from it. Thus, LSDMap in combination with metadynamics (and possibly every equivalent method) emerges as a powerful method to describe the energetics of ligand binding to DNA without resorting to intuitive ad hoc reaction coordinates.
Figures


Similar articles
-
Dissociation of minor groove binders from DNA: insights from metadynamics simulations.Nucleic Acids Res. 2008 Oct;36(18):5910-21. doi: 10.1093/nar/gkn561. Epub 2008 Sep 18. Nucleic Acids Res. 2008. PMID: 18801848 Free PMC article.
-
Crystal structure of a covalent DNA-drug adduct: anthramycin bound to C-C-A-A-C-G-T-T-G-G and a molecular explanation of specificity.Biochemistry. 1994 Nov 22;33(46):13593-610. doi: 10.1021/bi00250a011. Biochemistry. 1994. PMID: 7947769
-
Anthramycin-DNA binding explored by molecular simulations.J Phys Chem B. 2006 Dec 7;110(48):24687-95. doi: 10.1021/jp063155n. J Phys Chem B. 2006. PMID: 17134232
-
Investigating drug-target association and dissociation mechanisms using metadynamics-based algorithms.Acc Chem Res. 2015 Feb 17;48(2):277-85. doi: 10.1021/ar500356n. Epub 2014 Dec 12. Acc Chem Res. 2015. PMID: 25496113 Review.
-
Frontiers in molecular dynamics simulations of DNA.Acc Chem Res. 2012 Feb 21;45(2):196-205. doi: 10.1021/ar2001217. Epub 2011 Aug 10. Acc Chem Res. 2012. PMID: 21830782 Review.
Cited by
-
Multiscale approach to the determination of the photoactive yellow protein signaling state ensemble.PLoS Comput Biol. 2014 Oct 30;10(10):e1003797. doi: 10.1371/journal.pcbi.1003797. eCollection 2014 Oct. PLoS Comput Biol. 2014. PMID: 25356903 Free PMC article.
-
Predicting three-dimensional genome organization with chromatin states.PLoS Comput Biol. 2019 Jun 10;15(6):e1007024. doi: 10.1371/journal.pcbi.1007024. eCollection 2019 Jun. PLoS Comput Biol. 2019. PMID: 31181064 Free PMC article.
-
Unsupervised Learning Methods for Molecular Simulation Data.Chem Rev. 2021 Aug 25;121(16):9722-9758. doi: 10.1021/acs.chemrev.0c01195. Epub 2021 May 4. Chem Rev. 2021. PMID: 33945269 Free PMC article.
-
Reweighted Manifold Learning of Collective Variables from Enhanced Sampling Simulations.J Chem Theory Comput. 2022 Dec 13;18(12):7179-7192. doi: 10.1021/acs.jctc.2c00873. Epub 2022 Nov 11. J Chem Theory Comput. 2022. PMID: 36367826 Free PMC article.
-
DNA exit ramps are revealed in the binding landscapes obtained from simulations in helical coordinates.PLoS Comput Biol. 2015 Feb 12;11(2):e1003980. doi: 10.1371/journal.pcbi.1003980. eCollection 2015 Feb. PLoS Comput Biol. 2015. PMID: 25675216 Free PMC article.
References
Publication types
MeSH terms
Substances
Grants and funding
LinkOut - more resources
Full Text Sources
Other Literature Sources
Research Materials
Miscellaneous