Comparative Study
. 2014 Feb;171(3):646-62.
doi: 10.1111/bph.12460.

Bitter tasting compounds dilate airways by inhibiting airway smooth muscle calcium oscillations and calcium sensitivity

Affiliations
Comparative Study

Bitter tasting compounds dilate airways by inhibiting airway smooth muscle calcium oscillations and calcium sensitivity

Xiahui Tan et al. Br J Pharmacol. 2014 Feb.

Abstract

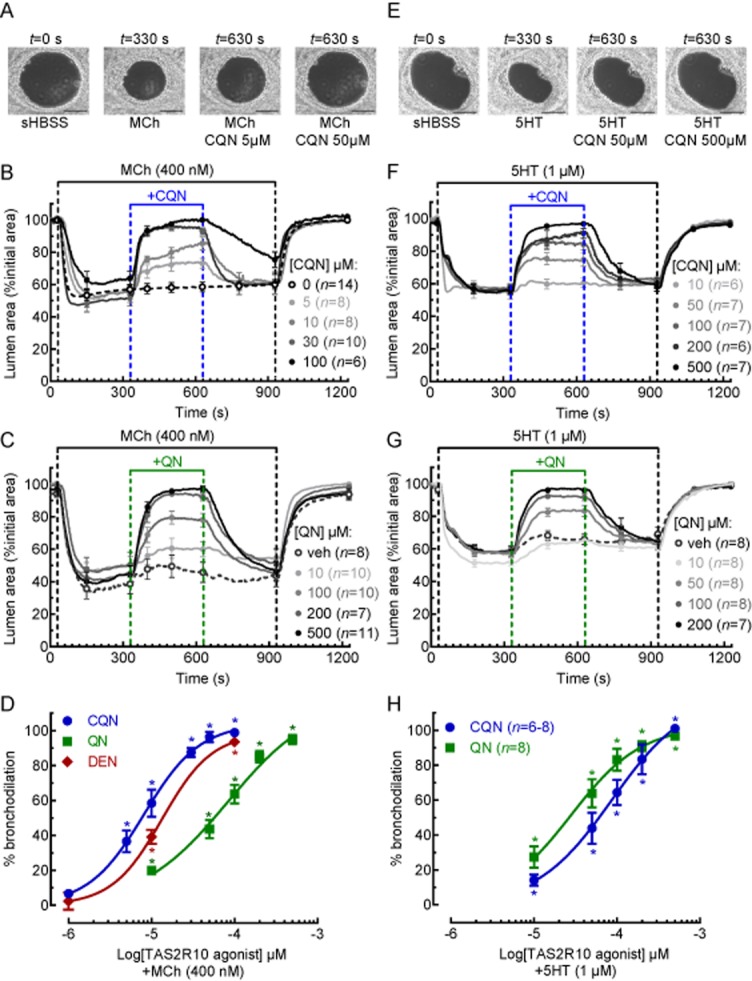
Background and purpose: While selective, bitter tasting, TAS2R agonists can relax agonist-contracted airway smooth muscle (ASM), their mechanism of action is unclear. However, ASM contraction is regulated by Ca²⁺ signalling and Ca²⁺ sensitivity. We have therefore investigated how the TAS2R10 agonists chloroquine, quinine and denotonium regulate contractile agonist-induced Ca²⁺ signalling and sensitivity.

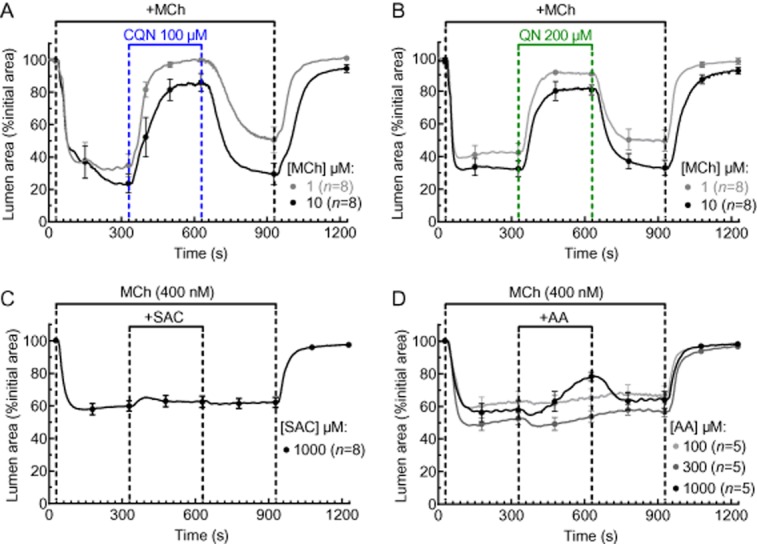
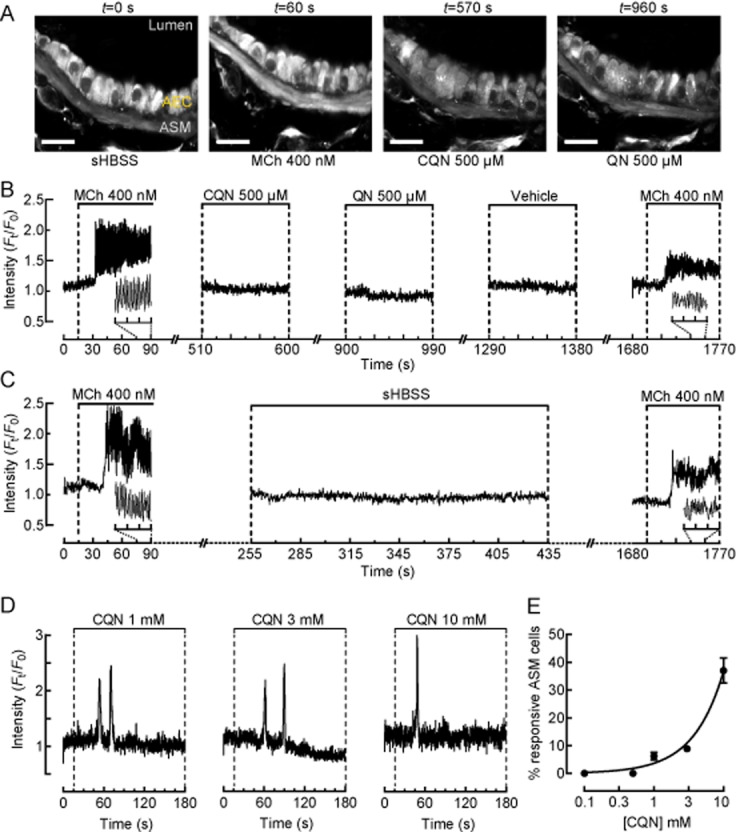
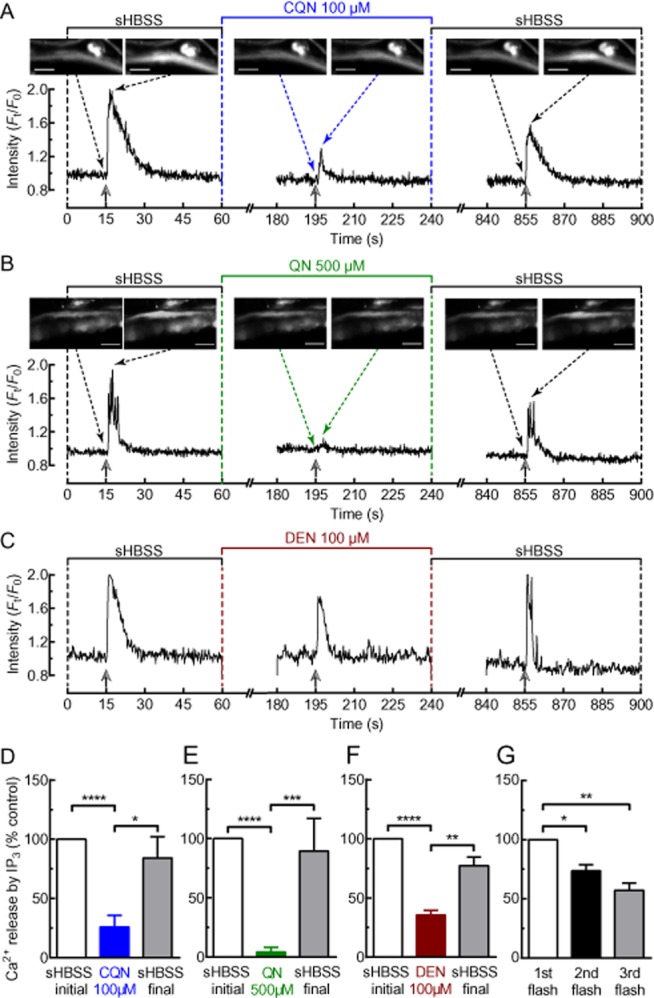
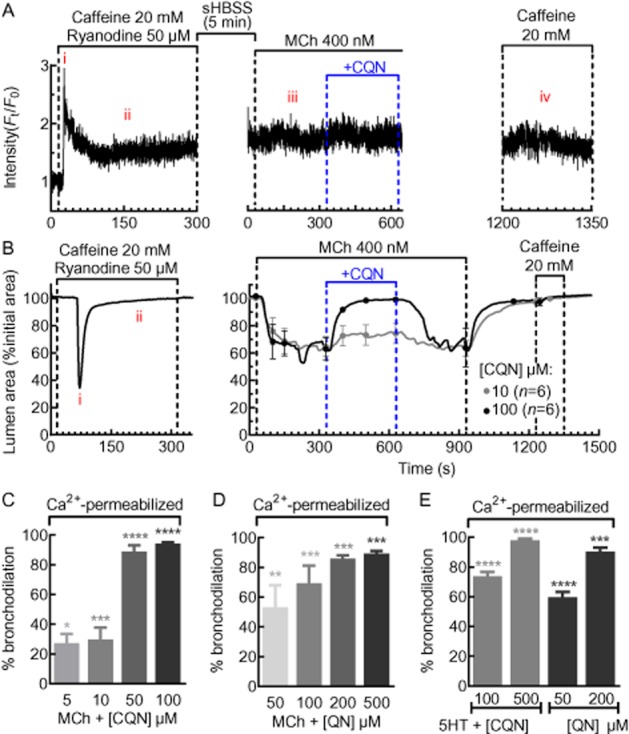
Experimental approach: Airways in mouse lung slices were contracted with either methacholine (MCh) or 5HT and bronchodilation assessed using phase-contrast microscopy. Ca²⁺ signalling was measured with 2-photon fluorescence microscopy of ASM cells loaded with Oregon Green, a Ca²⁺-sensitive indicator (with or without caged-IP₃). Effects on Ca²⁺ sensitivity were assessed on lung slices treated with caffeine and ryanodine to permeabilize ASM cells to Ca²⁺ .

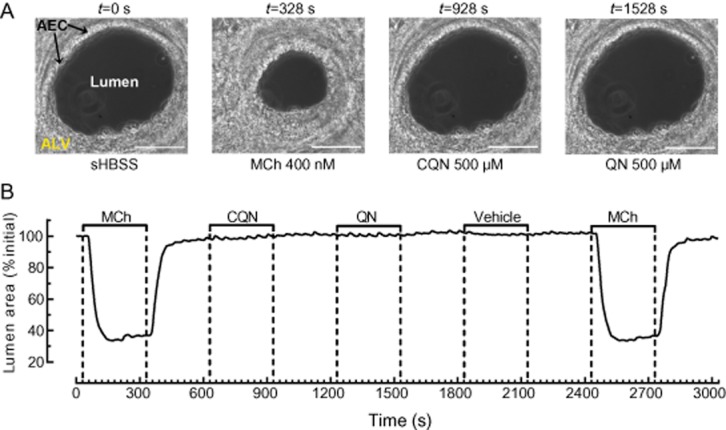
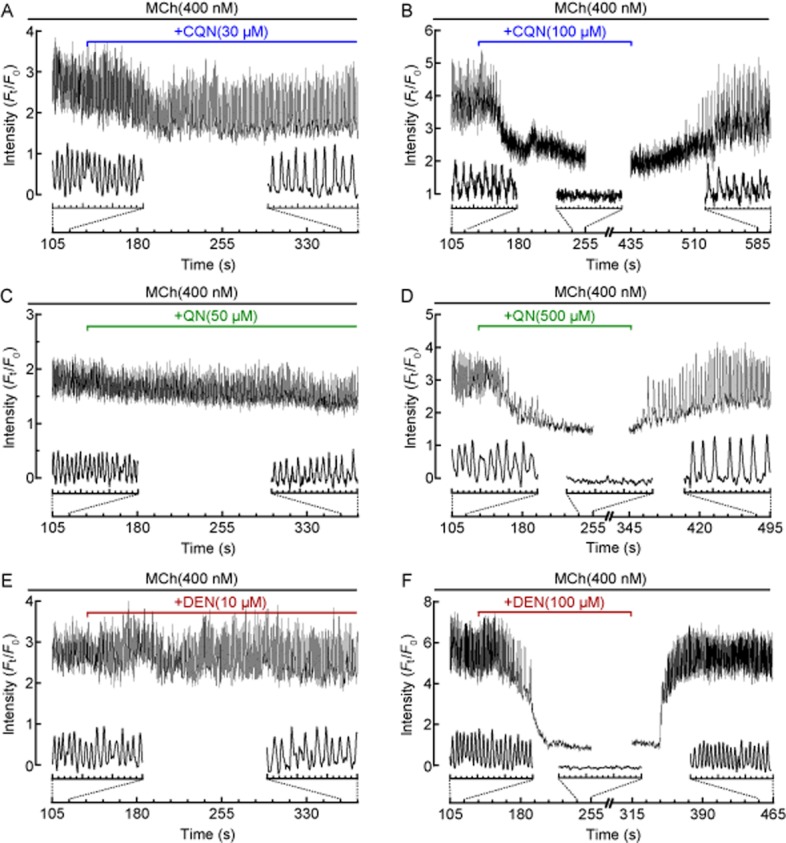
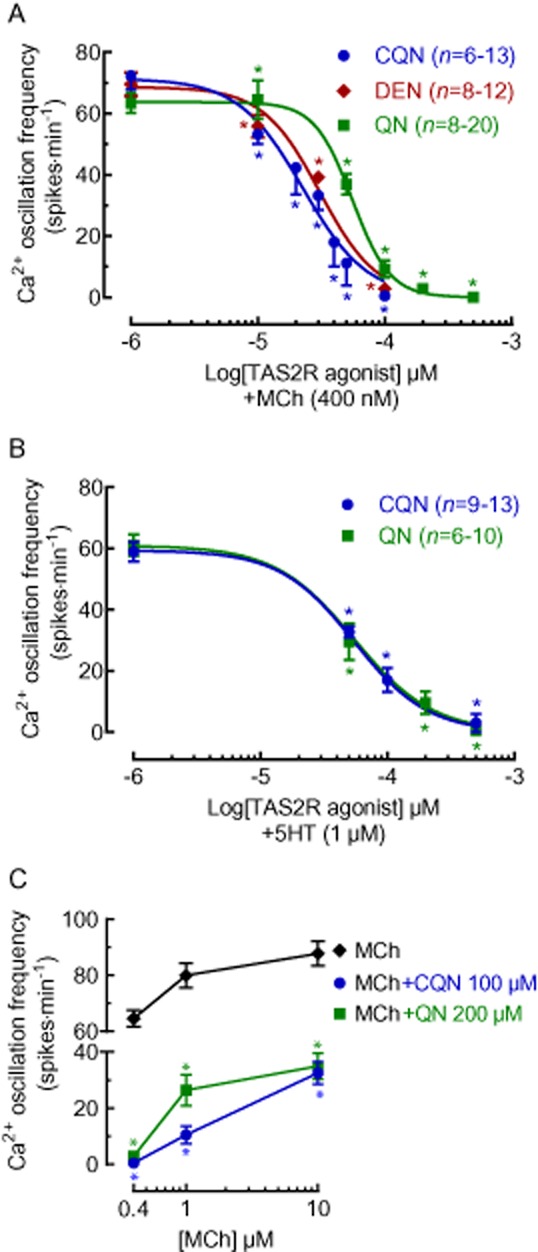
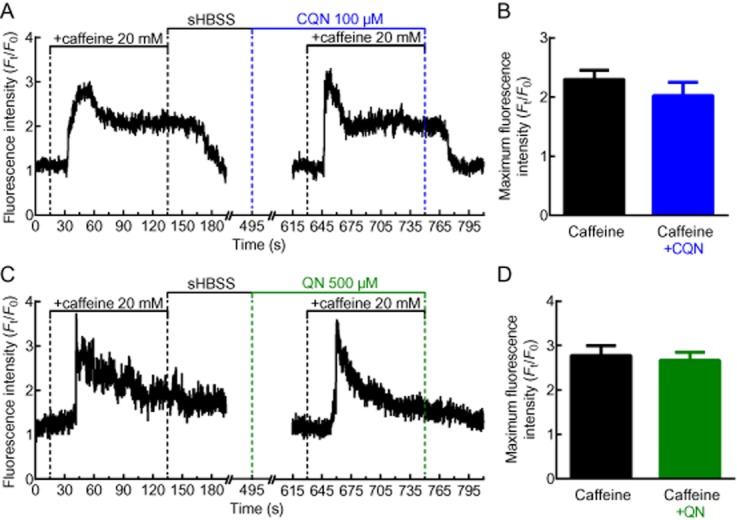
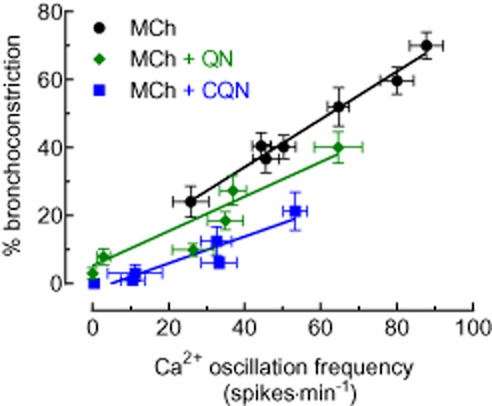
Key results: The TAS2R10 agonists dilated airways constricted by either MCh or 5HT, accompanied by inhibition of agonist-induced Ca²⁺ oscillations. However, in non-contracted airways, TAS2R10 agonists, at concentrations that maximally dilated constricted airways, did not evoke Ca²⁺ signals in ASM cells. Ca²⁺ increases mediated by the photolysis of caged-IP₃ were also attenuated by chloroquine, quinine and denotonium. In Ca²⁺-permeabilized ASM cells, the TAS2R10 agonists dilated MCh- and 5HT-constricted airways.

Conclusions and implications: TAS2R10 agonists reversed bronchoconstriction by inhibiting agonist-induced Ca²⁺ oscillations while simultaneously reducing the Ca²⁺ sensitivity of ASM cells. Reduction of Ca²⁺ oscillations may be due to inhibition of Ca²⁺ release through IP₃ receptors. Further characterization of bronchodilatory TAS2R agonists may lead to the development of novel therapies for the treatment of bronchoconstrictive conditions.

Keywords: 2-photon microscopy; TAS2R; asthma; mouse lung slice; β2-adrenergic receptor agonists.


Figures

Figure 1
Figure 1
Expression of mouse bitter-taste receptor tas2r107 on ASM. (A) A non-confocal transmitted-light image displaying a section of the airway lumen, epithelium and surrounding alveolar tissue. (B) ASM cells in the same airway were identified by αSMA expression (pseudo-coloured with red). (C) Expression of the bitter-taste receptor tas2r107 (pseudo-coloured with green). (D) The merged image of ASM cells expressing αSMA and tas2r107; ASM cells with positive staining for both αSMA and tas2r107 are indicated by yellow/orange pseudo-colour. (E) The αSMA and tas2r-positive ASM cells overlaid onto the transmitted-light image shows the ASM were localized adjacent to the airway epithelium. (F) To identify non-specific cross-reactivity of the tas2r polyclonal antibody, additional lung slices were stained with normal rabbit IgG isotype control in lieu of the tas2r antibody. Non-specific staining was pseudo-coloured with green in overlay image. Images are representative of three separate experiments conducted on 3 mice.
Figure 2
Figure 2
Effects of TAS2R10 agonists on MCh- and 5HT-induced airway constriction. Phase-contrast images (scale bar = 100 μm) of an airway in a lung slice under resting conditions and treated with (A) 400 nM MCh or (E) 1 μM 5HT in the absence and presence of chloroquine (CQN). (B, C) The effects of (B) chloroquine and (C) quinine (QN) at a range of concentrations and 0.5% DMSO vehicle in airways constricted with 400 nM MCh. (F, G) The effects of (F) chloroquine and (G) quinine at a range of concentrations in airways constricted with 1 μM 5HT. Each line represents the mean and each point represents the mean ± SEM of the lumen area normalized to the initial size at t = 0 s (D, H). The concentration-dependent bronchodilation of chloroquine, quinine and denotonium (DEN) in airways constricted with (D) 400 nM MCh and (H) 1 μM 5HT. Each point represents the mean ± SEM. All experiments were performed on lung slices prepared from 3 to 4 mice. *P < 0.05, significantly different from the MCh or 5HT responses.
Figure 3
Figure 3
Effects of TAS2R10 (chloroquine and quinine), TAS2R31 (aristolochic acid ) and TAS2R43 (saccharin) agonists on MCh-induced airway constriction. (A, B) Effects of (A) 100 μM chloroquine (CQN) and (B) 200 μM quinine (QN) on airways constricted with 1 μM and 10 μM MCh. (C, D) Effects (C) 1 mM saccharin (SAC) and (D) aristolochic acid (AA) at a range of concentrations on airways constricted with 400 nM MCh. Each line represents the mean and each point represents the mean ± SEM of the lumen area normalized to the initial size at t = 0 s. All experiments were performed on lung slices prepared from 2 to 3 mice.
Figure 4
Figure 4
Effects of TAS2R10 agonists on ASM cell Ca2+ signalling and bronchoconstriction. (A) A series of 2-photon fluorescence microscopy images (scale bar = 20 μm) showing ASM cells (ASM) adjacent to airway epithelial cells in the same airway of a mouse lung slice in response to sHBSS, 400 nM MCh, 500 μM chloroquine (CQN) and 500 μM quinine (QN) at various times (indicated above) during the experimental protocol in (B). (B) Ca2+ signal trace from the ASM cell shown (A) under resting (t = 0–15 s) and during treatment with 400 nM MCh (t = 15–90 s), 500 μM chloroquine (t = 510–600 s), 500 μM quinine (t = 900–990 s), 0.5% DMSO vehicle (t = 1290–1380 s) and 400 nM MCh (t = 1690–1770) with 5 min sHBSS washout intervals in between treatments (representative of n = 8, 3 mice). Inset traces show details of Ca2+ oscillations. (C) A control Ca2+ signal trace from a separate experiment demonstrating the effects of Ca2+-fluorescent indicator bleaching and/or extrusion due to extended experimental time on the fluorescence intensity associated with Ca2+ oscillations. (D) Ca2+ signal traces from ASM cells demonstrating 1 or 2 transient Ca2+ spikes in response to 1, 3 and 10 mM chloroquine. (E) The percentage of ASM cells displaying Ca2+ signals in response to increasing high concentrations of chloroquine (analysed from 75 to 80 ASM cells, 3–4 mice). For B–D, representative traces are expressed as intensity (Ft) normalized to the initial intensity at t = 0 s (F0), measured from a 10 × 10 pixel ROI of a single ASM cell.
Figure 5
Figure 5
Effect of TAS2R10 agonists on resting airway size. (A) Phase-contrast images (scale bar = 100 μm) showing an airway, lined with airway epithelial cell with surrounding alveolar tissue and (B) changes in lumen area of the same airway under resting condition (t = 0–30 s) and treated with 400 nM MCh (t = 30–330 s), 500 μM chloroquine (CQN; t = 630–930 s), and 500 μM quinine (QN; t = 1230–1530 s), 0.5% DMSO vehicle (t = 1830–2130 s) and 400 nM MCh (t = 2430–2730) with 5 min sHBSS washout in between treatments (representative of n = 9, 3 mice).
Figure 6
Figure 6
Effects of TAS2R10 agonists on MCh-induced Ca2+ oscillations in ASM cells. Representative traces showing intracellular Ca2+ signalling recorded in a single ASM cell contracted with 400 nM MCh in the absence and presence of (A, B) 30 and 100 μM chloroquine (CQN; from n = 12, 4 mice), (C, D) 50 and 500 μM quinine (QN; from n = 16, 4 mice) (E, F) 10 and 100 μM denotonium (DEN; from n = 8–13, 2 mice). Inset traces show details of Ca2+ oscillations or changes. Representative traces are expressed as intensity (Ft) normalized to the initial intensity at t = 0 s (F0), measured from a 10 × 10 pixel ROI of a single ASM cell.
Figure 7
Figure 7
Concentration-dependent effects of TAS2R10 agonists on MCh- and 5HT-induced Ca2+ oscillations in ASM cells. Lung slices were treated with either (A) 400 nM MCh or (B) 1 μM 5HT followed by chloroquine (CQN; from 4 mice), quinine (QN; from 4 mice) or denotonium (DEN; from 2 mice) at the indicated concentrations. (C) The effects of chloroquine (from 3 mice) and quinine (from 3 mice) on Ca2+ oscillations stimulated by 0.4 μM (n = 13 and n = 16 respectively), 1 μM (n = 14 and n = 12 respectively) and 10 μM (n = 18 and n = 24 respectively from 3 mice) MCh. All data are expressed as the mean ± SEM Ca2+ oscillation frequency (spikes·min−1). *P < 0.05, significantly different from the MCh or 5HT responses.
Figure 8
Figure 8
Effects of TAS2R10 agonists on IP3-induced Ca2+ signalling. (A–C) Representative Ca2+ signalling experiments performed in lung slices loaded with caged-IP3. A single ASM cell was exposed to a pulse of UV illumination (2 s) during resting conditions, after 2 min incubation with either (A) 100 μM chloroquine (CQN); (B) 500 μM quinine (QN); or (C) 100 μM denotonium (DEN) and after washout of the TAS2R10 agonist for 10 min. The change in [Ca2+]i was represented as the fluorescence intensity (Ft) of a 10 × 10 pixel ROI within the cell normalized to the initial intensity at t = 0 s (F0). Selected images (scale bar = 20 μm) in (A) and (B) show the analysed cell before and immediately after each UV flash. Solid and dotted arrows indicate time of UV flash and image shown, respectively. The amount of Ca2+ released in response to a UV flash is proportional to the area under the curve. Summary of results showing the effects of (D) chloroquine (n = 14, 3 mice), (E) quinine (n = 9, 2 mice) and (F) denotonium (n = 13, 2 mice) on Ca2+ signalling in response to uncaging of caged-IP3. (G) Summary of control experiment where an ASM cell received a UV flash in the absence of a TAS2R10 agonist (n = 6, 2 mice). Each bar in (D)–(G) represents the mean ± SEM of Ca2+ release expressed as % of the initial response to the first UV illumination. *P < 0.05, **P < 0.01, ***P < 0.001, ****P < 0.0001, significantly different as indicated.
Figure 9
Figure 9
Effects of chloroquine and quinine on SR Ca2+ levels. The effect of (A) chloroquine (CQN) and (C) quinine (QN) on Ca2+ release from the SR store SR induced by caffeine. Left panel shows control response in the absence of (A) chloroquine or (C) QN. Representative traces, expressed as intensity (Ft) normalized to the initial intensity at t = 0 s (F0), measured from a 10 × 10 pixel ROI of a single ASM cell. (B, D) Summary of the maximum fluorescence intensity generated by caffeine alone or in the presence of (B) chloroquine (n = 16, 3 mice) or (D) quinine (n = 12, 3 mice). Each bar represents the mean ± SEM.
None
The relationship between MCh-induced Ca2+ oscillations and bronchoconstriction. Ca2+ oscillation frequencies mediated by 0.05, 0.1, 0.2, 0.3, 0.4, 1 and 10 μM of MCh (n = 22–35, from 4 mice) were plotted against the % bronchoconstriction induced by corresponding concentrations of MCh (n = 15–20, 4 mice). A similar plot was generated using data collected from experiments characterising the inhibitory effects of chloroquine (CQN) and quinine (QN) on MCh-induced Ca2+ oscillations (n = 6–13 and 7–21, respectively) and bronchoconstriction (n = 6–14 and n = 7–11 respectively). A linear regression function was fitted for each data set.
Figure 11
Figure 11
Effects of chloroquine and quinine on MCh- and 5HT-induced Ca2+ sensitivity. (A) A representative trace of the Ca2+ signal generated from an ASM cell permeabilized to Ca2+ by caffeine and ryanodine. During Ca2+ permeabilization, Ca2+ showed a transient increase (Ai) followed by a sustained plateau (Aii). After caffeine and ryanodine washout, intracellular Ca2+ levels remained elevated and unchanged in response to MCh (Aiii), chloroquine (CQN) or caffeine (Aiv). The trace is expressed as the intensity (Ft) normalized to the initial intensity at t = 0 s (F0) and is representative of n = 12, 3 mice. (B) During Ca2+ permeabilization of lung slices, the airway shows a transient contraction (Bi) and returns to a dilated state (Bii). Subsequently, the airway was constricted with 400 nM MCh followed by a dilation induced by chloroquine. After washout with sHBSS, exposure to 20 mM caffeine had no effect on airway size or Ca2+ (Aiv), indicating that the ASM cells remained Ca2+ permeabilized throughout the experiment. The change in airway lumen area is expressed as % of initial lumen size and each trace shows the mean and each point shows the mean ± SEM. Summary of the bronchodilation responses to (C) chloroquine (n = 6, 3 mice) and (D) quinine (QN; n = 5–7, 3 mice) in MCh and (E) 5HT in Ca2+-permeabilized lung slices (n = 8–10, 3 mice). Each bar represents the mean ± SEM % bronchodilation response. *P < 0.05, **P < 0.01, ***P < 0.001, ****P < 0.000, significantly different from MCh or 5HT responses alone.

References

    1. Ahnert-Hilger G, Gratzl M. Controlled manipulation of the cell interior by pore-forming proteins. Trends Pharmacol Sci. 1988;9:195–197. - PubMed
    1. Alexander SPH, et al. The Concise Guide to PHARMACOLOGY 2013/14: Overview. Br J Pharmacol. 2013;170:1449–1867. - PMC - PubMed
    1. Ay B, Prakash YS, Pabelick CM, Sieck GC. Store-operated Ca2+ entry in porcine airway smooth muscle. Am J Physiol Lung Cell Mol Physiol. 2004;286:L909–L917. - PubMed
    1. Bai Y, Sanderson MJ. Airway smooth muscle relaxation results from a reduction in the frequency of Ca2+ oscillations induced by a cAMP-mediated inhibition of the IP3 receptor. Respir Res. 2006a;7:34. - PMC - PubMed
    1. Bai Y, Sanderson MJ. Modulation of the Ca2+ sensitivity of airway smooth muscle cells in murine lung slices. Am J Physiol Lung Cell Mol Physiol. 2006b;291:L208–L221. - PubMed

Publication types

MeSH terms

LinkOut - more resources