. 2013 Oct 10;52(1):87-100.
doi: 10.1016/j.molcel.2013.09.009.

Dosage of Dyrk1a shifts cells within a p21-cyclin D1 signaling map to control the decision to enter the cell cycle

Affiliations

Dosage of Dyrk1a shifts cells within a p21-cyclin D1 signaling map to control the decision to enter the cell cycle

Jia-Yun Chen et al. Mol Cell. .

Abstract

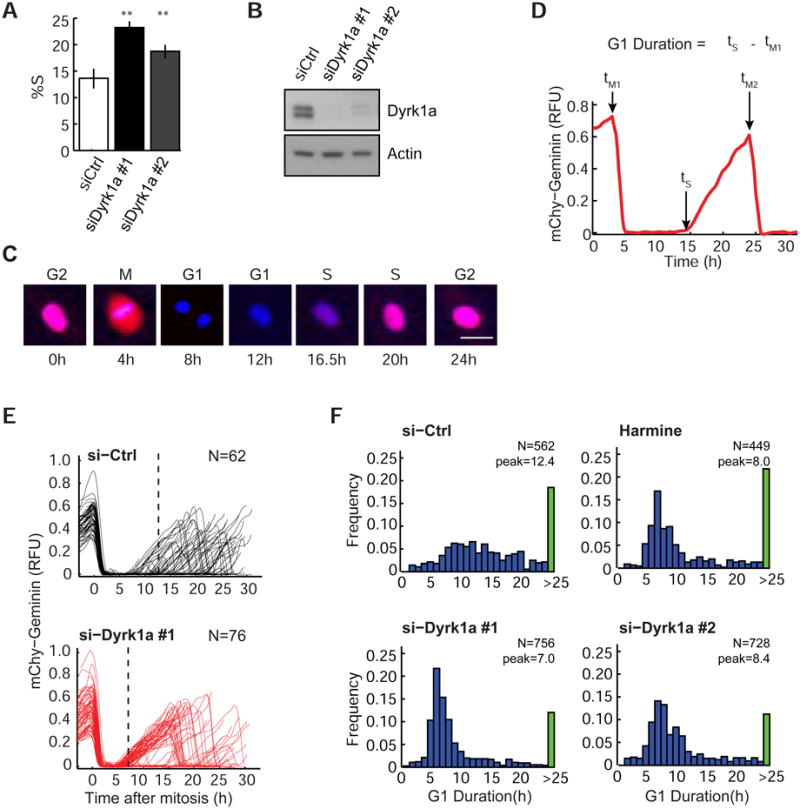
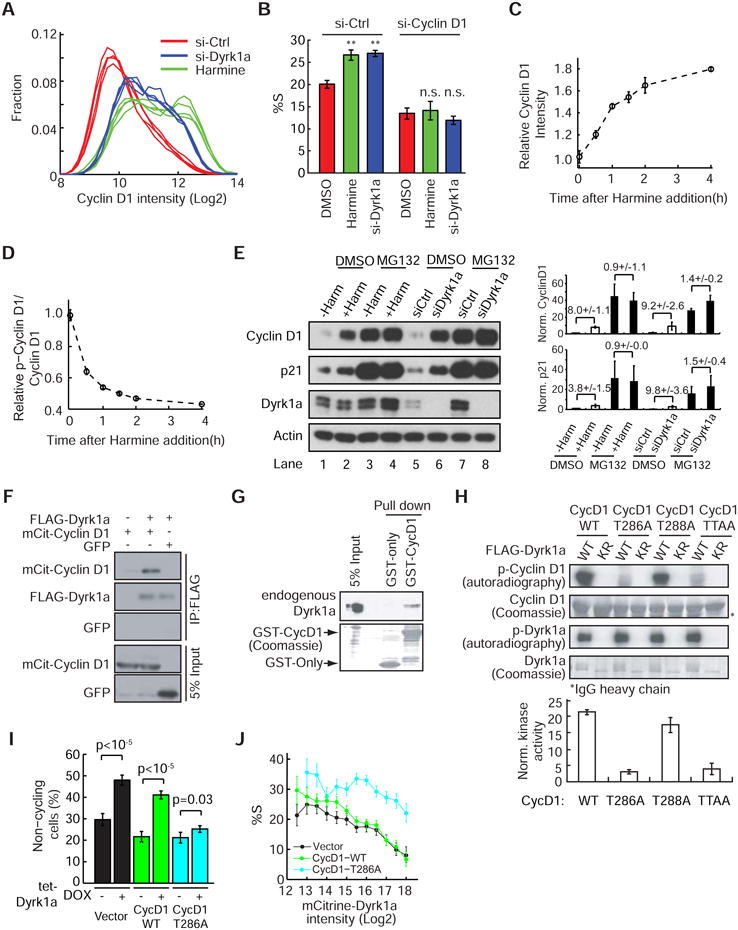
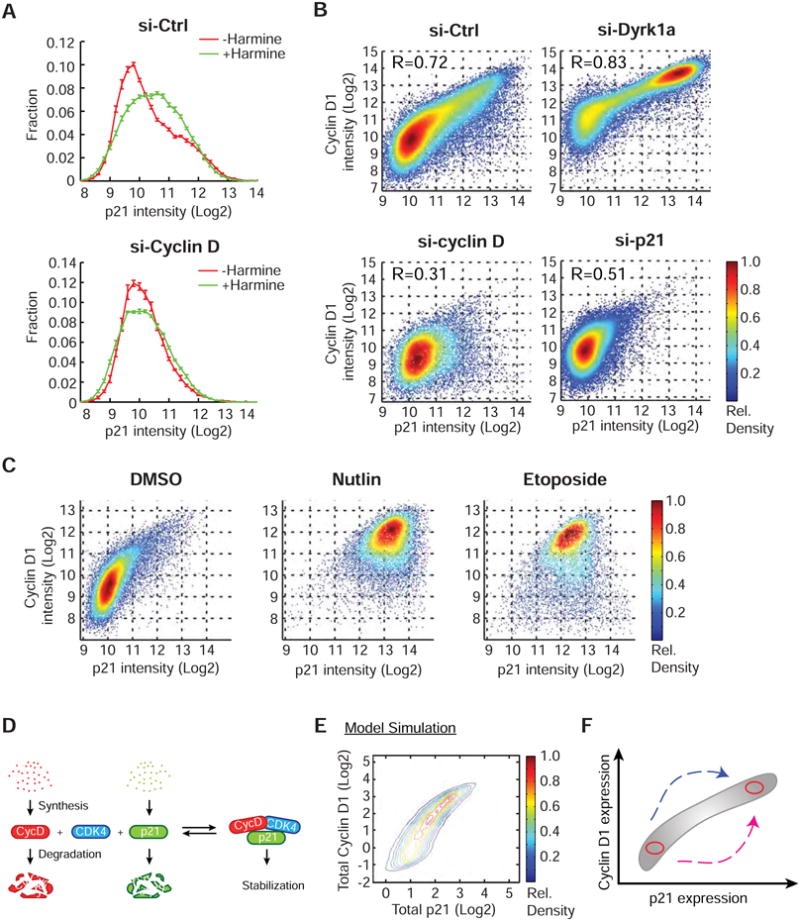
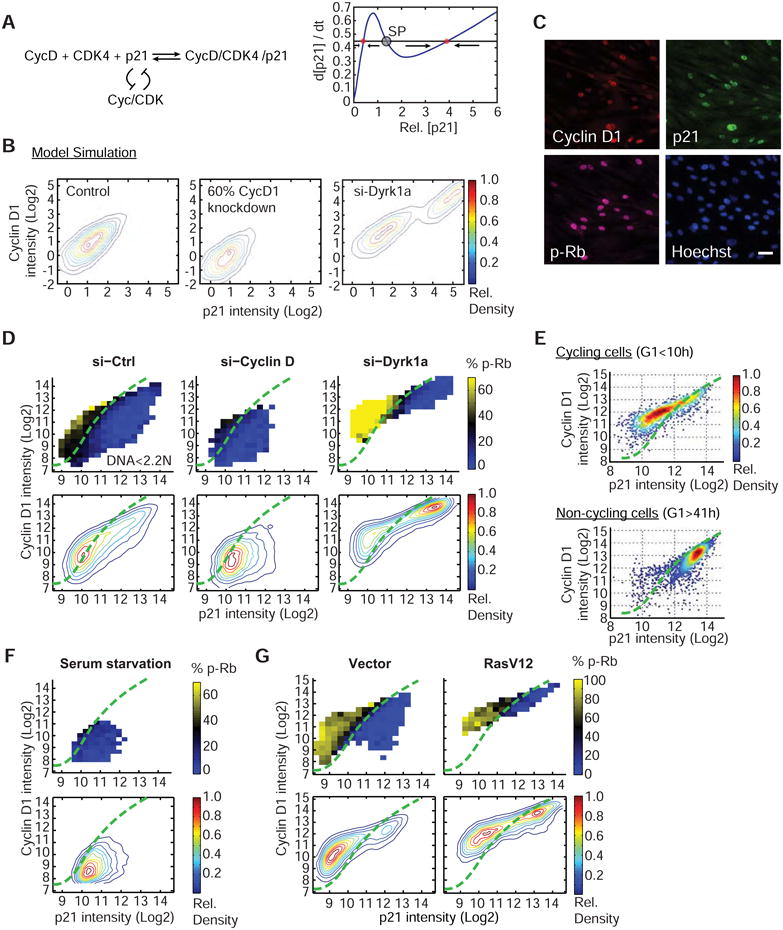
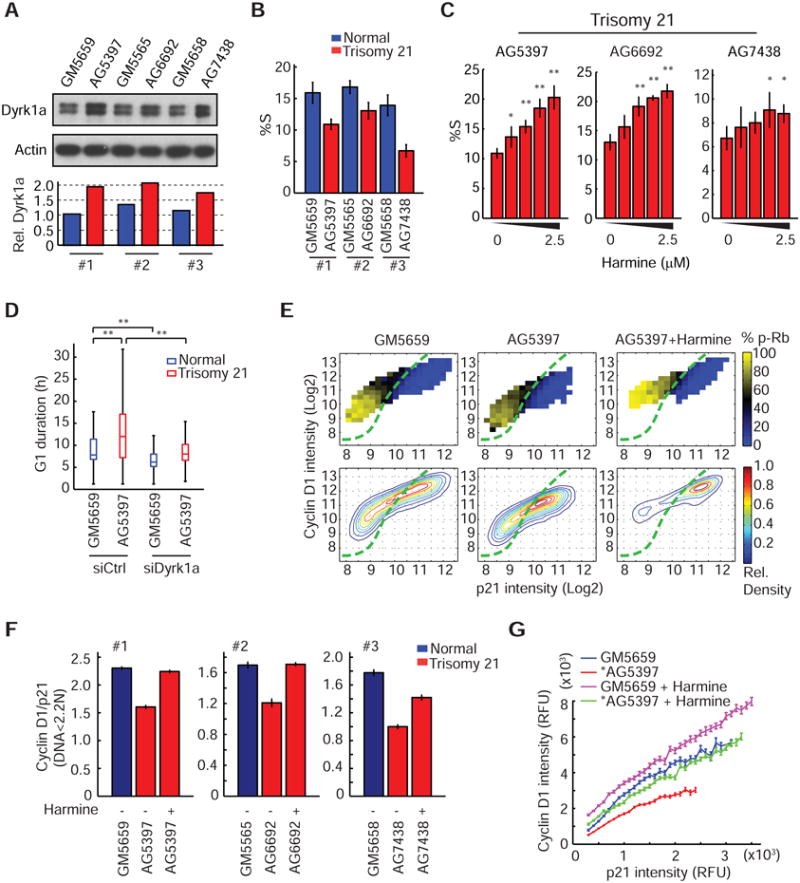
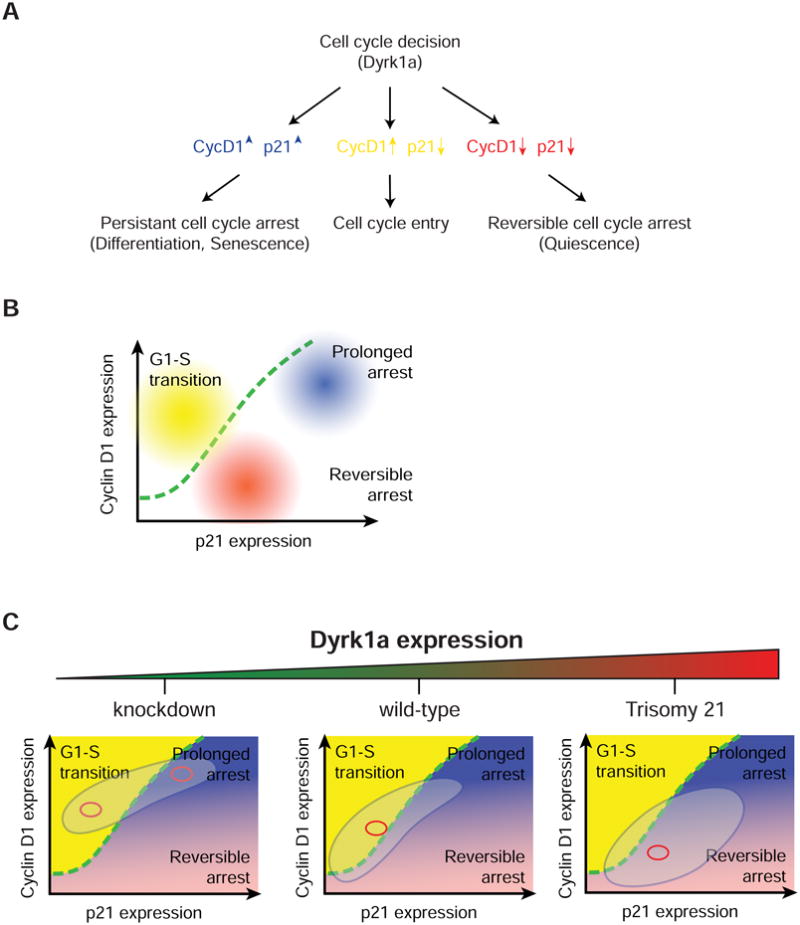
Mammalian cells have a remarkable capacity to compensate for heterozygous gene loss or extra gene copies. One exception is Down syndrome (DS), where a third copy of chromosome 21 mediates neurogenesis defects and lowers the frequency of solid tumors. Here we combine live-cell imaging and single-cell analysis to show that increased dosage of chromosome 21-localized Dyrk1a steeply increases G1 cell cycle duration through direct phosphorylation and degradation of cyclin D1 (CycD1). DS-derived fibroblasts showed analogous cell cycle changes that were reversed by Dyrk1a inhibition. Furthermore, reducing Dyrk1a activity increased CycD1 expression to force a bifurcation, with one subpopulation of cells accelerating proliferation and the other arresting proliferation by costabilizing CycD1 and the CDK inhibitor p21. Thus, dosage of Dyrk1a repositions cells within a p21-CycD1 signaling map, directing each cell to either proliferate or to follow two distinct cell cycle exit pathways characterized by high or low CycD1 and p21 levels.


Figures

Figure 1
Figure 1. Loss of Dyrk1a leads to shortened G1 duration and reduced G1 variability
(A) Knockdown of Dyrk1a increases the percentage of cells in S-phase (%S) (mean ± SD of 4 wells; **: p<0.01). (B) Knockdown efficiency of synthetic siRNAs against Dyrk1a. (C) Images of a BJ-5ta cell proceeding through the cell cycle. Images are overlays of H2B-mTurq (blue) and mChy-Geminin (red). Scale: 40nm. (D) Single cell trace of mChy-Geminin shown in (C). (E and F) Loss of Dyrk1a significantly shortens G1 duration. Graph showing mChy-Geminin traces in individual cells treated with control or Dyrk1a siRNA (dotted line: median G1 duration) (E). Histograms of G1 duration in cells treated with the indicated siRNAs or Dyrk1a-specific inhibitor (Harmine) at 3μM (peak: median G1 duration excluding cells that do not finish G1 phase (>25h, green bar)) (F). Only cells with at least one mitosis during the imaging period were included in the plot. N: cell numbers. See also Figure S1.
Figure 2
Figure 2. Dosage effect of Dyrk1a on G1 cell cycle progression
(A) Induction of siRNA-resistant mCit-Dyrk1a by doxycycline (DOX). DOX was used at 0.1μg/ml. (B) Rescue of Dyrk1a knockdown by DOX-induced expression of WT but not kinase-dead (KR) mCit-Dyrk1a. G1 duration is shown with boxplots (**: p<0.01). Only cells that had finished an entire G1 phase were counted. For the rescue (+DOX), only cells that were mCit-positive were included. (C) Comparison of cell cycle progression in cells expressing mCit-Dyrk1a WT (left) or mCit-Dyrk1a KR (right) under si-Dyrk1a conditions. DOX (0.1μg/ml) was added to cells 24h prior to live-imaging. Heat-maps of mChy-Geminin intensities in individual cells over time are shown. Each horizontal line represents a single cell. Blue and yellow represent low and high mChy-Geminin intensity, respectively. Cells were clustered first according to their time of mitosis and then to their time of S-phase entry. (D) Examples of two BJ-5ta cells expressing high or low levels of mCit-Dyrk1a WT, proceeding through the cell cycle. (Left) Images are overlays of H2B-mTurq (blue) and mChy-Geminin (red). Images of mCit-Dyrk1a WT (green) were taken and shown at the end of the movie (42h). (Right) mChy-Geminin traces of the two indicated cells (left) in the images. The corresponding mCit-Dyrk1a intensity is marked on the right (green dots). “G1” indicates G1 duration. Scale: 40μm. (E-F) Dose-dependent effect of Dyrk1a on G1 cell cycle progression. As in (D), after extracting the G1 duration and final mCit intensities from all of the tracked cells (C), G1 duration (E) was plotted as a function of mCit intensity. For (F), CycD1 intensity was then measured by immunostaining as a function of mCit intensity in the final frame. The gray box marks the mCit-tagged protein expression levels that are equal to 100-200% of the endogenous Dyrk1a levels. Data represents mean ± SEM of cells within a given bin. (G) Effect of Dyrk1a on CycD1 protein level changes. See also Figure S2.
Figure 3
Figure 3. The cell cycle effect of Dyrk1a is mediated by direct phosphorylation and subsequent degradation of CycD1
(A) Frequency plot showing the increase of CycD1 in cells treated with Dyrk1a-siRNA or Harmine. Each line represents the average frequency data from one well as a function of CycD1 intensity (n>2000 cells per well). (B) The %S (percent in S-phase) increase in cells treated with Dyrk1a-siRNA or Harmine is mediated through CycD1 (**: p<0.01; n.s.: p-value is not significant; mean ± SD of 4 replicate wells). (C & D) Rapid increase of CycD1 and decrease of phospho-CycD1 (T286) after Harmine treatment (mean ± SD of 4 replicate wells). The phospho-CycD1 staining signal was normalized by the CycD1 staining intensity per cell. (E) The Dyrk1a-mediated CycD1 degradation is proteasome-dependent. Mock or siRNA-treated cells were incubated with either DMSO or MG132 ± 5μM Harmine for 4h, lysed and analyzed by western blotting (left). The expression level of CycD1 and p21 were quantified and normalized with actin (right, mean ± SEM of 4 replicates). Fold-changes ± SEM are labeled on top of each pair. (F) Dyrk1a interacts with CycD1. Transfected 293T cells were lysed and FLAG-tagged proteins were isolated with M2-beads. (G) CycD1 interacts with Dyrk1a. The recombinant GST-tagged proteins were incubated with crude cell lysates. Glutathione beads-bound protein complex were isolated and analyzed. (H) Dyrk1a phosphorylates CycD1 at Thr 286. 293T cells were transfected with FLAG-Dyrk1a WT or KR. FLAG-tagged proteins were isolated and an in vitro kinase assay was performed using recombinant GST-CycD1 variants as substrates. The kinase reactions were analyzed by SDS-PAGE and autoradiography. The kinase activities were quantified and normalized with FLAG-Dyrk1a (bottom, mean ± SEM of 4 replicates). (I & J) Overexpression of CycD1-T286A but not the wild-type can suppress the Dyrk1a-dependent cell cycle arrest. Empty vector, CycD1-WT, or the CycD1-T286A mutant were introduced to BJ-5ta reporter cells expressing tet-mCit-Dyrk1a and subjected to antibiotic selection. In (I), the cell lines were followed by time-lapse imaging ± DOX and the percent of non-cycling cells were calculated (mean ± SD of 4 replicate wells). In (J), the cell lines were pulsed with BrdU and the percent in S-phase (%S) was then measured as a function of mCit-Dyrk1a intensity (mean ± 95% bootstrap confidence interval). See also Figure S3.
Figure 4
Figure 4. Co-dependent stabilization of CycD1 and p21
(A) Frequency plots showing that the increase of p21 after 6h of Harmine treatment is due to CycD (mean ± SD of 4 replicate wells). (B) Density scatter plots of p21 versus CycD1 fluorescence intensity. Note that cells with high-CycD1 and high-p21 levels (top-right quadrant) were lost upon CycD1 or p21 knockdown. R: Pearson's correlation coefficients. (C) Density scatter plots showing that an increase in p21 leads to an increase in CycD1. Nutlin and Etoposide (24h) were used to increase p21 levels. (D) Schematic showing that CycD1 and p21 are protected from degradation when they assemble in a p21/CycD1/CDK4 complex. (E) Model simulations for the single cell distribution of total p21 and CycD1 levels using the scheme shown in (D). (F) Schematic showing two routes to reach high-CycD1 and high-p21 protein levels. See also Figure S4.
Figure 5
Figure 5. Dyrk1a generates a bimodal distribution in the p21-CycD1 map and forces a decision between cell cycle entry and two distinct cell cycle exit pathways
(A) Schematic showing that adding a p21-degradation based double negative feedback to the CycD1 and p21 co-stabilization scheme (left) creates a bifurcation in p21 levels (right). SP: saddle point. (B) Modeling recreates the bimodal distribution in the p21-CycD1 map in Dyrk1a-siRNA cells and the unimodal distribution in control and CycD1-siRNA cells. Of note, the equilibrium distribution in a bistable system depends on whether the starting concentration of CycD1 is high or low. In the case shown for the control and CycD1-siRNA condition, CycD1 started low, and in the case shown for Dyrk1a knockdown, CycD1 started high. (C) Automated image analysis monitors CycD1, p21 and phospho-Rb (S807/811) (p-Rb). Scale bar: 40μm. (D) Heat map analysis of p21-CycD1 intensity and phospho-Rb at G1 phase (DNA content less than 2.2 N) shows a clear boundary between cycling and non-cycling regions. Contour plots of cell density from all cell cycle phases are shown in the lower panels. The percent of p-Rb-positive cells (% phospho-Rb) was calculated for equally-spaced bins of the p21 and CycD1 intensity and is marked according to the color bar. Cells were treated with indicated siRNAs for 72h before analysis. The boundary (green line) was drawn across the black colored-bins on the siCtrl heat map and overlaid on top of the other plots (Supplemental Information). Each panel contains ∼20,000 cells. Note that due to day-to-day staining and imaging variations, the boundary position compares experiments done at the same time. (E) Persistent G1-arrested si-Dyrk1a cells are marked by high CycD1 and high p21 levels. Time-lapse imaging followed by immunostaining for CycD1 and p21 enabled the measurement of G1 duration and final p21 and CycD1 levels for each cell. Cycling cells: cells that entered G1 phase for less than 10h. Non-cycling cells: cells that stayed in G1 phase for the entire imaging time (42h). The plots only include cells that were in G1 phase at the end of imaging. (F & G) Heat map analysis of p21-CycD1 intensity and phospho-Rb at G1 phase in serum-arrested cells (F) or RasV12 expressing cells (G). See also Figure S5 & S6.
Figure 6
Figure 6. Extra-dosage of Dyrk1a in Down syndrome-derived fibroblasts contributes to G1 cell cycle changes
(A) An extra-copy of Dyrk1a gene in DS-derived fibroblasts increases Dyrk1 protein level by 1.6-fold. Representative western blot (top) and the quantification of band intensity (bottom) are shown. Three pairs of age-matched normal (blue) and DS cells (red) were used for the analysis. (B) Quantification showing reduced proliferation (%S) in DS cells (mean ± SD of 6 replicate wells). (C) Dose-dependent increase of proliferation in DS cells treated with Harmine (0 to 2.5μM, 2-fold dilution from the right; mean ± SD of 4 replicate wells; **: p<0.01; *: p<0.05). (D) Box plot showing an increase of G1 duration in DS cells compared to its age-matched control and that this increase could be reduced by knockdown of Dyrk1a (**: p<0.01). (E) Heat map analysis showing a shift of the DS cell (AG5397) distribution toward lower CycD1 levels (middle) compared to the normal control (GM5659) (left). Addition of Harmine rescues the shift and further pushes the population to the top-right quadrant (right). Assays were performed as described in Figure 5D. The boundary was drawn according to GM5659 cells. (F) Quantification showing a decrease of CycD1/p21 ratio in DS cells and that the decrease was restored by Harmine treatment (mean ± SD of 4 replicate wells). (G) The ratio decrease in DS cells (*) shown in (F) is due to a relative decrease of CycD1 when compared within the same p21 binning intensity. The decrease was rescued by Harmine treatment (mean ± SEM, n> 50 cells per bin). See also Figure S7.
Figure 7
Figure 7. Dyrk1a-mediated shifts in the p21-CycD1 signaling map lead to cell cycle entry or one out of the two cell cycle exit decisions
(A & B) Schematic and graph representation showing that three cell fates including the G1-S transition (cycling state), reversible G1 arrest (non-cycling state) and prolonged arrest (non-cycling state) can be distinguished by their respective 2D p21-CycD1 signaling map. (C) Dyrk1a dosage-induced p21-CycD1 response that spreads the population of cells across different cell fate regions. Red circle depicts the center of mass. The big circle depicts the population distribution.

Similar articles

Cited by

References

    1. Altafaj X, Dierssen M, Baamonde C, Marti E, Visa J, Guimera J, Oset M, Gonzalez JR, Florez J, Fillat C, et al. Neurodevelopmental delay, motor abnormalities and cognitive deficits in transgenic mice overexpressing Dyrk1A (minibrain), a murine model of Down's syndrome. Hum Mol Genet. 2001;10:1915–1923. - PubMed
    1. Baek KH, Zaslavsky A, Lynch RC, Britt C, Okada Y, Siarey RJ, Lensch MW, Park IH, Yoon SS, Minami T, et al. Down's syndrome suppression of tumour growth and the role of the calcineurin inhibitor DSCR1. Nature. 2009;459:1126–1130. - PMC - PubMed
    1. Becker L, Mito T, Takashima S, Onodera K. Growth and development of the brain in Down syndrome. Prog Clin Biol Res. 1991;373:133–152. - PubMed
    1. Becker W. Emerging role of DYRK family protein kinases as regulators of protein stability in cell cycle control. Cell Cycle. 2012;11:3389–3394. - PMC - PubMed
    1. Bornstein G, Bloom J, Sitry-Shevah D, Nakayama K, Pagano M, Hershko A. Role of the SCFSkp2 ubiquitin ligase in the degradation of p21Cip1 in S phase. J Biol Chem. 2003;278:25752–25757. - PubMed

Publication types

MeSH terms